
Debugging Dynamic Memory Usage Errors Using HP WDB

To view the leak profile, complete the following steps:
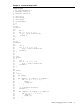
1. Run the debugger and load the program by entering the following command:
$ gdb <executable> <arguments>
or
$ gdb –leaks <executable> <arguments>
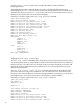
2. Enable leak checking by entering the following command:
(gdb) set heap-check leaks on
(if the –leaks option is not used in Step 1)
NOTE: Alternatively, you can use the set heap-check on command to automatically
enable the detection of leaks by toggling the set heap-check leaks on command. This
command enables the detection of leaks, heap profiles, bounds checking, and checking for
double frees.
3. Set breakpoints in the code at probe-points where you want to examine cumulative leaks
by entering the following command:
(gdb) b <probe-points>
4. Run the program in the debugger by entering the following command:
(gdb) run
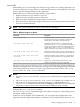
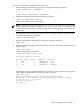
5. When the breakpoint triggers, enter the following info leaks command to display the list of
memory leaks:
(gdb) info leaks
The following output is displayed:
Scanning for memory leaks...done
2439 bytes leaked in 25 blocks
No. Total bytes Blocks Address Function
0 1234 1 0x40419710 foo()
1 333 1 0x40410bf8 main()
2 245 8 0x40410838 strdup()
[...]
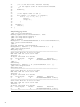
The debugger assigns a numeric identifier for each leak. To view a stack trace for a specific
leak, specify the leak number from the list of leaks, as follows:
(gdb) info leak 2
245 bytes leaked in 8 blocks (10.05% of all bytes leaked)
These range in size from 26 to 36 bytes and are allocated in strdup ()
in link_the_list () at test.c:55
in main () at test.c:13
in _start ()
Memory-Debugging Features of WDB 29