
Debugging Dynamic Memory Usage Errors Using HP WDB

Incremental Heap Profile
The incremental profile displays the outstanding allocations at multiple probe points in an
application at runtime. This profile is analogous to processing multiple snapshot profiles.
Example 2 (page 21) illustrates this feature.
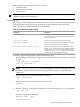
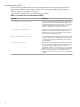
Table 5 lists the commands for incremental heap-profiling.
Table 5 Commands for Incremental Heap-Profiling
DescriptionCommand
Starts the incremental heap growth profile. All allocations
prior to the execution of this command are ignored. If
incremental heap growth profile is already on, executing
this command resets the counters and starts a fresh
collection. The interval is specified in seconds.
set heap-check interval <nn>
Enables you to specify the number of intervals for which
WDB must collect the incremental heap growth. The
default value is 100. Every repeat of the interval tracks
heap allocation during that interval.
set heap-check repeat <nn>
Creates a detailed report of the heap growth. The data for
each interval has the start and end time of the interval. If
a filename is specified, the detailed report is written in
the specified file.
info heap-interval <filename>
When incremental heap profile is used the heap growth
data is internally stored by WDB in a temporary file. The
heap growth data gathered during each interval is
appended to this file . If the session is very long, this file
may become very large. This command discards the data
existing in the file and creates a new data file. If the
command is executed, the user cannot see the old data in
the file.
set heap-check reset
20