
Debugging Dynamic Memory Usage Errors Using HP WDB
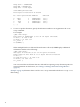
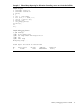

Example 1 Filtered Heap Reporting for Allocations Exceeding <num> at a Particular Call-Site
Sample Program
1 #include <stdio.h>
2 #include <stdlib.h>
3 main()
4 {
5 int i, *arr[1000];
6 for (i=0; i < 1000; i++)
7 arr[i] = malloc (49);
8 malloc (30);
9 set_brkpt_here(0)
10 exit(0);
11
12 }
Sample Debugging Session
$ gdb minheap
(gdb) b set_brkpt_here
(gdb) set heap-check min-heap-size 31
(gdb) run
(gdb) info heap
Analyzing heap ...
49000 bytes allocated in 1000 blocks
No. Total bytes Blocks Address Function
0 49000 1000 0x4044eff0 main()
Memory-Debugging Features of WDB 19