
Debugging Dynamic Memory Usage Errors Using HP WDB
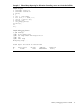
Heap Start = 0x40408000
Heap End = 0x4041a900
Heap Size = 76288 bytes
Outstanding Allocations:
41558 bytes allocated in 28 blocks
No. Total bytes Blocks Address Function
0 34567 1 0x40411000 foo()
1 4096 1 0x7bd63000 bar()
2 1234 1 0x40419710 baz()
3 245 8 0x404108b0 boo()
[...]
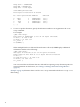
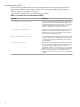
5. To view a specific allocation, specify the allocation number as an argument to the info
heap command.
For example:
(gdb) info heap 1
4096 bytes at 0x7bd63000 (9.86% of all bytes allocated)
in bar () at test.c:108
in main () at test.c:17
in _start ()
in $START$ ()
When multiple blocks are allocated from the same call stack, WDB displays additional
information similar to the following:
(gdb) info heap 3
245 bytes in 8 blocks (0.59% of all bytes allocated)
These range in size from 26 to 36 bytes and are allocated
in boo ()
in link_the_list () at test.c:55
in main () at test.c:13
in _start ()
You can control the stack frames that are collected for reporting at any allocation point. For
more information on this feature, see “Settings to Manage Performance Degradation. ”
(page 55)
Example 1 (page 19) illustrates the use of the info heap command with the min-heap-size
filter setting.
18