
Debugging Dynamic Memory Usage Errors Using HP WDB

WDB supports the following heap-analysis profiles:
• Snapshot Profile
• Incremental Heap Profile
• Arena Profile
NOTE: Heap profiling must be enabled to view heap reports. The set heap-check on
command enables heap profiling also.
Snapshot Profile
The snapshot profile displays the outstanding heap allocations at a specific instant (probe point)
at runtime. It does not display the blocks that are already freed before the probe point.
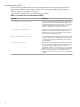
Table 4 lists the basic commands used for heap profiling.
Table 4 Commands for Heap Profiling
DescriptionCommand
Displays the heap report that includes the current heap
allocations, the sizes of the blocks allocated, and number
of allocation instances.
info heap
Writes the heap report output to the specified file.
info heap <filename>
Displays detailed information about the specified heap
allocation including the allocation call stack.
info heap <idnumber>
Reports the heap allocations that exceed the specified
number, <num>, of bytes based on the cumulative number
of bytes that are allocated at each call-site inclusive of
multiple calls to malloc() at a particular call site). See
Example 1 (page 19) for more information.
set heap-check min-heap-size <num>
To obtain a snapshot heap profile, complete the following steps:
1. Run the debugger and load the program by entering the following command at command
prompt:
$ gdb <executable> <arguments>
(gdb) set heap-check on
NOTE: The set heap-check on command enables the memory-debugging feature in
WDB. This enables the detection of leaks, heap profiles, bounds checking, checking for
double free
2. Set a breakpoint by entering the following command:
(gdb) b <probepoint>
3. Run the program by entering the following command:
(gdb)run
4. When the program is stopped at a breakpoint, enter the following info heap command:
(gdb) info heap
The following output is displayed:
Analyzing heap ...done
Actual Heap Usage:
Memory-Debugging Features of WDB 17