
Debugging Dynamic Memory Usage Errors Using HP WDB
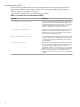

Table 2 Compiler Options for Memory Debugging
DescriptionCompiler Option
The +check compiler options provide runtime checks to
detect out-of-bounds array references
(+check=bounds), memory leaks and heap corruption
(+check=malloc), writing outside the stack
frame(+check=stack), and un-initialized variables
(+check=uninit). The +check=all option enables
all the available runtime checks for the +check compiler
option.
A failed check results in the program abort at runtime.
The error message and the stack trace is printed to
stderr before the program terminates. The environment
variable RTC_NO_ABORT must be set to 1 to continue the
program execution after a failed runtime check. This
enables you to collect the diagnostics for all the failed
checks in a single execution run.
+check=
[all|none|bounds|malloc|stack|uninit]
NOTE: The +check options must be specified at compile time and link time. If different +check
options are specified while compiling different source files, all the specified +check options are
needed at link time. Multiple +check options are interpreted from left to right with the options
on the right overriding earlier +check options.
For more information on the HP aC++ compiler options for memory debugging, see the HP aC++
World Wide Webpage at:
http://www.hp.com/go/cpp
For more information on the HP aC++ compiler options for memory debugging, see the HP C
World Wide Webpage at:
http://www.hp.com/go/c
Memory-Debugging Features of WDB
WDB supports the following memory-debugging features:
• Heap Profiling features
• Leak Profiling feature
• Error Injection features
• Event Monitoring features
In addition to these features, HP WDB provides the following generic commands for memory
debugging:
Table 3 Generic Commands for Memory Checking
DescriptionCommand
Toggles the setting of commands for detecting leaks,
bounds, double frees, and heap profiling.
set heap-check <on/off>
Displays the current settings for memory checking
show heap-check
Heap Profiling
You can profile the heap usage in an application by using WDB. The heap-profiling feature
enables you to analyze the influence of algorithms and data structures on heap usage and tune
the memory requirements of an application.
16