
Debugging Dynamic Memory Usage Errors Using HP WDB

The typical causes for logical leaks are listed below:
— Leaks caused by premature allocation of memory
The application allocates the memory much ahead of the actual use of the allocated
memory.
— Leaks caused by delayed de-allocation
The application delays the freeing the allocated block beyond the actual use of the
allocated memory.
— Leaks caused by failure to utilize allocated memory
The application allocates memory, but fails to use the allocated memory.
NOTE: WDB supports the debugging of physical memory leaks only. It does not detect
logical memory leaks.
Access Errors
Memory access errors can occur under the following conditions:
• When reading un-initialized local, or heap data
• When reading or writing to nonexistent, unallocated, or unmapped memory
• When a stray pointer overflows the bounds of a heap block, or tries to access a heap block
that is already freed to cause buffer overruns and under-runs
• When reading or writing to memory locations that are already freed in the program
NOTE: WDB provides minimal support for debugging some of the memory access errors. The
scrambling feature and detection for out-of-bounds writes are supported by WDB.
Using WDB to Debug Memory Problems
WDB supports the memory-debugging of applications involving dynamic allocations and
de-allocations of virtual memory blocks, or during the calls to libc string routines like strcpy(),
and memcpy(). It debugs memory-related problems at the time of allocation or de-allocation of
memory blocks. It supports the detection of outstanding memory-related problems at specific
user-defined probe-points (breakpoints) during the use of the memory blocks. Memory-related
problems that appear after the specified probe points are not detected. It does not support the
debugging of access errors that are caused when reading from or writing to un-allocated,
un-initialized, or de-allocated memory.
WDB does not support the memory-debugging of the stack, static memory, and register memory.
WDB provides the interactive, batch, and attach modes for debugging memory-related problems.
See “Supported Modes of Memory-debugging in WDB” (page 55) for more information on the
supported modes for debugging.
HP aC++/ HP C Compiler Runtime Checking Options
The HP aC++/HP C compiler also provides options for enabling memory debugging using WDB
in Integrity Systems. This feature is supported only on Integrity Systems.
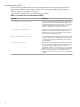
Table 2 list the runtime checking options are available in HP aC++/HP C compilers for memory
debugging.
Using WDB to Debug Memory Problems 15