
Debugging Dynamic Memory Usage Errors Using HP WDB v6.3 (5900-2181, August 2012)
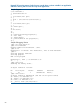
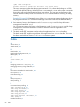

Example 25 Work-Around when program execution is in a frame that belongs to the GDB internal
leak detection library
...
(gdb) set heap-check on
(gdb) r
Starting program: corruption
warning: Memory block (size = 80 address = 0x40453970) appears to be corrupted at the end.
Allocation context not found
#1 main() at corruption.c:4
#2 main_opd_entry() from
warning: Use command backtrace (bt) to see the current context.
Ignore top 4 frames belonging to leak detection library of gdb.
__rtc_event () at ../../../Src/gnu/gdb/infrtc.c:1173
warning: Source file is more recent than library library librtc.so.
1173 */
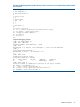
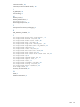
(gdb) bt
#0 __rtc_event () at ../../../Src/gnu/gdb/infrtc.c:1173
#1 0x200000007d0fbd40:0 in check_bounds (pointer=0x40453970, size=80,
pclist=0x404309e4) at ../../../Src/gnu/gdb/infrtc.c:1278
#2 0x200000007d100f50:0 in rtc_record_free ()
at ../../../Src/gnu/gdb/infrtc.c:2261
#3 0x200000007d1025a0:0 in free () at
../../../Src/gnu/gdb/infrtc.c:2575
#4 0x4000950:0 in main () at corruption.c:10
(gdb) info corruption
Analyzing heap ...
Current thread is inside the allocator. Try again later.
(gdb) frame 3
#3 0x200000007d1025a0:0 in free () at
../../../Src/gnu/gdb/infrtc.c:2575
2575 __rtc_event (RTC_HEAP_GROWTH, pointer,0,0);
(gdb) finish
Run till exit from #3 0x200000007d1025a0:0 in free ()
at ../../../Src/gnu/gdb/infrtc.c:2575
0x4000950:0 in main () at corruption.c:10
10 free (x);
(gdb) info corruption
Analyzing heap ...
FAQ
1 Does WDB report all the leaks in a program?
WDB uses a conservative leak detection algorithm. As a result, all leaks may not be reported,
but all reported leaks are definite leaks. WDB reports leaks only in the code path exercised
in the current run.
2 I wrote a small sample program that allocates a block using malloc() and leaks the block
immediately, by assigning NULL to the pointer, but WDB does not report this block as a leak.
Why?
This is attributed to the leak detection algorithm followed by WDB. If the datum in the program
address space masks a leak, the leak is not reported. In this case the address returned from
malloc() is stored in the architecture registers and consequently masks the leak. Typically,
if you call any function after the leak, such as a printf(), then WDB can catch the leak.
3 Does WDB support detection of leaks in a third party code?
Yes. WDB supports detection of leaks in a third party code also.
4 What are the commands that the batch mode of memory-debugging does not support?
For more information on the commands that are supported in batch mode, see “Summary of
Memory Debugging Commands” (page 59)
5 Can WDB debug applications with user-defined memory management routines?
WDB can debug applications with memory management routines that are either user defined
or are wrappers to the default memory management routines.
82