
Debugging Dynamic Memory Usage Errors Using HP WDB v6.3 (5900-2181, August 2012)
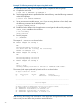

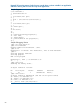

Example 17 Collecting memory leak report using batch mode
To collect the memory leak report using batch mode, complete the following steps:
a. Compile the source file.
$ aCC -Ae -o memLeak -g memLeak.c
b. Set the target application to preload the librtc runtime library, enter the following command
at the HP-UX prompt:
$ chatr +rtc enable memLeak
c. Set an environment variable BATCH_RTC. If you are using the Korn or Posix shell, enter
the following command at the HP-UX prompt:
$ export BATCH_RTC=on
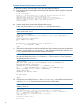
d. Enable the leaks detection for the application run and get the call stack by setting the
check_leaks variable as shown below.
$ cat rtcconfig
check_leaks=on
e. Run the program.
$ ./memLeak
The output of ./memLeak is as shown below:
a. Enter length of string 1
25
Allocating memory of size 20
Too small size for a string, not allocating
Number of badInput is 1
b. Enter length of string 1
35
Allocating memory of size 20
Allocating memory of size 35
c. Enter length of string 2
35
str1 <= str2
warning: Memory leak info is written to "memLeak.5944.leaks".
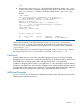
The memory leak report produced by batch rtc file is as shown below:
20 bytes leaked in 1 blocks
No. Total bytes Blocks Address Function
0 20 1 0x40061a00 allocateMemory()
-------------------------------------------------------------------------
Detailed Report
-------------------------------------------------------------------------
20 bytes leaked at 0x40061a00 (100.00% of all bytes leaked)
#0 0x04000d62 allocateMemory() at memLeak.c:11
#1 0x04000e62 createHeader() at memLeak.c:24
#2 0x04000f32 createString() at memLeak.c:37
#3 0x040012b2 compareStrings() at memLeak.c:74
After knowing the memory leak information in the application through batch mode, select the
leaks one by one and follow the procedure mentioned below.
72