
Debugging Dynamic Memory Usage Errors Using HP WDB v6.3 (5900-2181, August 2012)
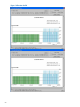
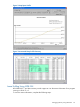
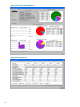
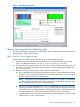

Figure 7 Arena Block Distribution
Step by Step Approach for Detecting Leaks
This section provides the guidelines and a sample test case to enable you detect memory leaks by
going through a step by step procedure.
Steps to Detect Point of Memory Leak
To detect the point of memory leak, ensure that you go through following steps:
1. Enable memory leak detection for the application run and collect the leak report in batch
mode. To enable leak detection, use check_leaks=on in the rtcconfig file.
2. The batch mode run reports memory leaks. From this report, pick up the leaks one by one and
detect the point of leak following the instructions below. Run the application under gdb with
the -leaks command.
3. Detect the location of memory leak using the steps mentioned below.
a. Insert a breakpoint at the function that allocates the memory. Step into the calling function
using the finish command and collect leak information with the info leaks command
after the execution reaches the calling function.
NOTE: If the address of the allocated memory location is in a register or if the address
is in RSE contents, then the leak information is not shown and henceforth means that some
data in the program still points to the allocated memory.
b. Continue the previous step and step into the next calling function in the stack trace and
collect leak information with the info leaks command after the execution reaches the
next calling function. If a leak information is displayed, then you can infer that the pointer
to the allocated memory is lost before getting into the function or in the function.
c. Find the statement causing the loss of this pointer to the allocated memory in caller of the
current function or in the current function.
Step by Step Approach for Detecting Leaks 69