
Debugging Dynamic Memory Usage Errors Using HP WDB v6.3 (5900-2181, August 2012)
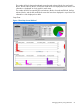
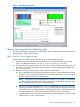
6. Select View->Memory Usage->Incremental Heap to view the incremental heap profile.
7. The Incremental Heap View window displays the incremental heap profile graph for the
program
The incremental heap profile graph can be plotted based on the outstanding allocations in
the program or the actual heap profile, as follows:
• To view the incremental heap profile graph based on the outstanding allocations, select
the Allocation option in the Plot Graph frame. The Allocation Profile displays the
outstanding allocations (in KB) in the program with a unique color coding for each interval.
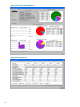
• To view the incremental heap profile graph based on the actual heap profile, select the
Actual Heap option in the Plot Graph frame. The Heap Space Profile displays the heap
size in KB for the program.
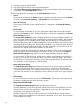
To specify the time interval for displaying the incremental heap profile, you must select the
Select Time option and specify the start time and the end time from the Start Time list menu
and the End Time list menu. The listings for time in the Start Time list menu and the End Time
list menu are calculated by dividing the total program execution time into five equal intervals.
Additionally, you can enter a custom start time, or a custom end time for displaying the
incremental heap profile.
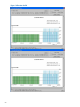
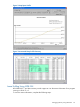
To view the incremental heap profile summary, click Summary Table. The summary table
displays the record ID, the start time, the end time, the heap interval, the heap start, the heap
end, the heap size in bytes, the number of allocated bytes, and the number of blocks used
for all the collected incremental heap profile records. Click on the required incremental heap
profile record to view the block allocation details for the corresponding record.
Snap Shots:
Debugging Memory Using WDB GUI 63