
Debugging Dynamic Memory Usage Errors Using HP WDB v6.3 (5900-2181, August 2012)
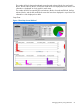
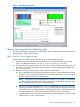

Table 16 Commonly Used Commands for Memory Debugging (continued)
Batch ModeInteractive Mode/Attach ModeDescription
starts a fresh collection. The interval is
specified in seconds.
Not supported in Batch Modeset heap-check repeat <num>Enables you to specify the number of
intervals for which WDB must collect
the incremental heap growth. The
default value is 100. Every repeat of
the interval tracks heap allocation
during that interval.
Not supported in Batch Modeinfo heap intervalCreates a detailed report of the heap
growth. The data for each interval has
the start and end time of the interval.
Not supported in Batch Modeset heap-check
high-mem-count <X_number>
Stops when break value has moved
<X_number> times
Not supported in Batch Modeinfo heap high-memDisplays the number of times break
value changes for a given run
Not supported in Batch Modeinfo heap <process|arenas>Displays the high level memory-usage
of a process or an arena. Lists the
number of free blocks, used blocks,
small blocks, holding blocks, node
blocks and regular blocks.
Not supported in Batch Modeset heap-check header-size
<no of bytes>
Sets the Header guard for each block
of the allocated memory. The default
number of bytes for the header is 16
bytes if this option is not used.
Not supported in Batch Modeset heap-check footer-size
<no of bytes>
Sets the Footer guard for each block
of the allocated memory. The default
number of bytes for the footer is one
byte if this option is not used.
Not supported in Batch Modeset heap-check
retain-freed-blocks <on/off>
Enables you to detect the dangling
pointers and in block corruption of
freed blocks.
Not supported in Batch Modeset heap-check compiler
<on/off>
Enables you to stop whenever
compiler detects corruption in
variables allocated by compiler. The
application should be compiled with
+check=all option.
check_openfd=[on|off]Not supported in Interactive ModeEnables you to detect open file
descriptors.
Debugging Memory Using WDB GUI
The WDB GUI is a Graphical User Interface (GUI) designed by Hewlett-Packard for WDB. It can
be used to debug native-compiled HP C, HP aC++, and Fortran programs on Itanium-based systems
running HP-UX 11i v2 or HP-UX 11i v3, and PA-RISC systems running HP-UX 11.0, HP-UX 11i v1,
HP-UX 11i v2, or HP-UX 11i v3.
The WDB GUI offers the following capabilities to debug memory–related errors in an application
• Detects corruption caused by calls to strcpy(), memset(), and memcopy()
• Stops program-execution at free of an unallocated or de-allocated block address
• Stops program-execution when block is freed if bad writes occur before or after block bounds
• Scrambles previous memory contents on malloc() or free() calls
Debugging Memory Using WDB GUI 61