
Debugging Dynamic Memory Usage Errors Using HP WDB v6.3 (5900-2181, August 2012)

$ chatr +rtc <enable> <executable>
NOTE: To preload from a path that is different from the default paths, you must use the
LD_PRELOAD environment variable.
• Instead of automatically preloading librtc and mapping the shared libraries, you can
explicitly preload the required librtc library.
Set the environment variable, LD_PRELOAD as follows:
◦ For 32-bit applications running on Itanium,
LD_PRELOAD=/opt/langtools/lib/hpux32/librtc.so <executable> <arguments>
◦ For 64-bit applications running on Itanium,
LD_PRELOAD=/opt/langtools/lib/hpux64/librtc.so <executable> <arguments>
◦ For 32-bit applications running on PA-RISC,
LD_PRELOAD=/opt/langtools/lib/librtc.sl <executable> <arguments>
◦ For 64-bit applications running on PA-RISC,
LD_PRELOAD=/opt/langtools/lib/pa20_64/librtc.sl <executable> <arguments>
If LD_PRELOAD and chatr +rtc are used to preload the librtc.[sl|so] runtime
library, librtc[sl|so] is loaded from the path specified by LD_PRELOAD.
3. Identify the required process (using the ps command) and attach the debugger to the process
as follows.
gdb -leaks <executable-name> <process-id>
4. Insert breakpoints at suitable probe-points. When the breakpoints trigger, use the info heap
and info leaks commands to display the heap and leak profile.
NOTE: To attach and find leaks for PA-32 applications from the startup, the environment variable
RTC_INIT must be set to on in addition to preloading the librtc.[sl|so] library before
starting the application, as follows:
$ LD_PRELOAD=/opt/langtools/lib/librtc.sl RTC_INIT=on <executable>
If RTC_INIT is enabled, librtc.[sl|so] starts recording heap information for PA32 process
by default. Hence, you must set this environment variable only when it is required. You must not
export the RTC_INIT environment variable for shell.
Summary of Memory Debugging Commands
Most of the commands available in the interactive and the attach modes are also available in the
batch mode. Table 16 (page 59)lists the commands that are available in the batch mode and the
equivalent commands in the interactive mode. It also lists the commands that are not supported in
the batch mode.
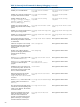
Table 16 Commonly Used Commands for Memory Debugging
Batch ModeInteractive Mode/Attach ModeDescription
set heap-check <on/off>set heap-check <on/off>Enables heap profiling
set heap-check leaks <on/off>set heap-check leaks
<on/off>
Enables you to detect leaks.
set heap-check free <on/off>set heap-check free <on/off>Enables you to detect double-frees and
frees with improper arguments
Summary of Memory Debugging Commands 59