
Debugging Dynamic Memory Usage Errors Using HP WDB v6.3 (5900-2181, August 2012)
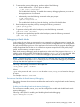

Example 14 Scrambling a memory block on de-allocation
Sample Program
$ cat scramble.c
1 #include <stdio.h>
2 #include <malloc.h>
3
4 int
5 main ()
6 {
7 char **tp;
8 tp = malloc (100);
9 printf ("Batch RTC test over, *tp=%p.\n", *tp);
10 fflush(stdout);
11 free(tp);
12 exit (0);
13 }
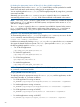
Sample Debugging Session
$ gdb scramble
HP gdb 5.5 for PA-RISC 1.1 or 2.0 (narrow), HP-UX 11.00
and target hppa1.1-hp-hpux11.00.
Copyright 1986 - 2001 Free Software Foundation, Inc.
Hewlett-Packard Wildebeest 5.5.8 (based on GDB) is covered
by the GNU General Public License. Type "show copying" to
see the conditions to change it and/or distribute copies.
Type "show warranty" for warranty/support.
..
(gdb) set heap-check scramble on
(gdb) b main
Breakpoint 1 at 0x295c: file scramble.c, line 8 from scramble.
(gdb) r
Starting program: scramble
Breakpoint 1, main () at scramble.c:8
8 tp = malloc (100);
(gdb) n
9 printf ("Batch RTC test over, *tp=%p.\n", *tp);
(gdb) p *tp
$1 = 0xfeedface <Error reading address 0xfeedface: Bad address>
Open-files reporting
From version 6.2 onwards, HP WDB enables you to obtain a report containing a list of file
descriptors corresponding to files open by the application at the point of its exit. The report not
only provides you the names and types of those files, but also details such as backtraces and
function names at the point of the files being opened. This enables you to identify potential file
descriptor leaks in the application.
Memory-Debugging Features of WDB 45