
Debugging Dynamic Memory Usage Errors Using HP WDB v6.3 (5900-2181, August 2012)
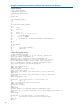
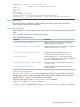

Breakpoint 2, main () at null-random.c:12
12 printf("Out of memory simulated\n");
(gdb) p i
$2 = 110
(gdb) c
Continuing.
Out of memory simulated
warning: Malloc is returning simulated 0x00000000 value
0x70e78e8c in __rtc_nomem_event+0x4 () from /opt/langtools/lib/librtc.sl
Event Monitoring
The event monitoring commands in WDB enable you to monitor specific heap events and
heap-corruption problems in an application.
Monitoring Heap Events
WDB enables you to monitor specific events such as the size of memory allocations, the high water
mark.
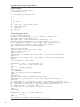
Table 9 lists the commands for monitoring heap events.
Table 9 Monitoring Heap Events
DescriptionCommand
Stops program execution when the block at the given
address is allocated or de-allocated
set heap-check watch <address>
Stops program execution when a program tries to allocate
a block larger than num-bytes in size
set heap-check block-size <num-bytes>
Stops program execution when the program tries to
increase the program-heap by at least num-bytes
set heap-check heap-size <num-bytes>
Displays the highest brk() value and the number of
brk() value changes for a given run. This number signifies
the number of times that the heap grows.
info heap high-mem
Stops program execution when break value has moved
<X_number> times
set heap-check high-mem-count <X_number>
Toggles the detection of double-frees and frees with
improper arguments
set heap-check free <on|off>
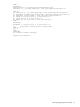
Monitoring a Specific Address
The set heap-check watch command enables you to monitor a specific address. It instructs
the debugger to stop the program execution and transfer execution control to the user when the
specified block at <address> is allocated, or de-allocated.
Following is the syntax for the set heap check watch command:
(gdb) set heap-check watch <address>
Example 7 (page 30) illustrates the use of the set heap-check watch <address> command.
Memory-Debugging Features of WDB 29