
Debugging Dynamic Memory Usage Errors Using HP WDB v6.3 (5900-2181, August 2012)
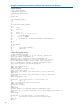

(gdb) info heap arenas
num_arenas: 1
expansion: 4096
Arena ID: 0
Total number of blocks in arena: 47
Start address: 0x4001003c
Ending address: 0x40480ffc
Total space: 4657088
Number of bytes in free small blocks: 69216
Number of bytes in used small blocks: 199584
Number of bytes in free ordinary blocks: 2480
Number of bytes in used ordinary blocks: 4375600
Number of bytes in holding block header: 912
Number of small blocks: 3500
Number of ordinary blocks: 9
Number of holding blocks: 35
Number of free ordinary blocks: 1
Number of free small blocks: 388
NOTE: WDB-GUI provides graphical representation of the Arena Profile. For more information
see“Arena Profiling Using WDB GUI” (page 65).
Leak Profiling
The leak profile feature in WDB conservatively identifies the blocks of memory that are leaked in
an application, and displays the stack trace that shows when the block was allocated. All the leaks
detected by WDB are definite physical leaks.
WDB uses a garbage collection algorithm to identify the blocks that are leaked. It identifies the
root-set of memory that are possible pointers to the heap. The initial root-set includes the shared
library data, the program/thread stacks, the registers, the thread specific private data, the mmap
regions, and the shared memory regions. The initial root-set includes all data except the heap
blocks.
The debugger considers suitably aligned words in the root-set as possible pointers to the heap.
The debugger performs a reachability analysis based on the root-set, and determines the memory
blocks that are reachable through possible pointers from the root-set. The heap blocks that are not
reachable through possible pointers from the root-set are reported as leaks.
WDB is conservative in detecting the memory leaks. The memory leaks can be masked if a datum
in the root-set inadvertently holds a possible pointer to a heap block.
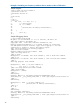
Table 7 lists the basic commands for leak profiling in WDB.
Table 7 Commands for Leak Profiling
DescriptionCommand
Controls WDB memory leak checkingset heap-check leaks <on/off>
Displays a leak report. It also lists information such as the
leaks, size of blocks, and number of instances.
info leaks
Writes the complete report output containing the leak
summary as well as the details to the specified file.
info leaks <filename>
Displays detailed information on the specified leak
including the allocation call stack
info leak <leaknumber>
Specifies the minimum leak size for stack trace collection.
The debugger continues to report leaks that are smaller
set heap-check min-leak-size <num>
than <num> bytes, but it does not provide the stack trace
for the same. By default, num is set to 0.
Memory-Debugging Features of WDB 21