
Debugging Dynamic Memory Usage Errors Using HP WDB v6.3 (5900-2181, August 2012)
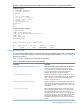
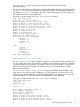

5. To view a specific allocation, specify the allocation number as an argument to the info
heap command.
For example:
(gdb) info heap 1
4096 bytes at 0x7bd63000 (9.86% of all bytes allocated)
in bar () at test.c:108
in main () at test.c:17
in _start ()
in $START$ ()
NOTE: To get the latest heap allocation details for a particular block number <num>, you
must first enter the info heap command followed by info heap <num>.
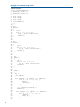
When multiple blocks are allocated from the same call stack, WDB displays additional
information similar to the following:
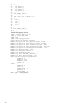
(gdb) info heap 3
245 bytes in 8 blocks (0.59% of all bytes allocated)
These range in size from 26 to 36 bytes and are allocated
in boo ()
in link_the_list () at test.c:55
in main () at test.c:13
in _start ()
You can control the stack frames that are collected for reporting at any allocation point. For
more information on this feature, see “Settings to Manage Performance Degradation” (page 48)
Example 1 (page 13) illustrates the use of the info heap command with the min-heap-size
filter setting.
12