
Debugging Dynamic Memory Usage Errors Using HP WDB v6.3 (5900-2181, August 2012)

Snapshot Profile
The snapshot profile displays the outstanding heap allocations at a specific instant (probe point)
at runtime. It does not display the blocks that are already freed before the probe point.
Table 4 lists the basic commands used for heap profiling.
Table 4 Commands for Heap Profiling
DescriptionCommand
Displays the heap report that includes the current heap
allocations, the sizes of the blocks allocated, and number
of allocation instances.
info heap
Writes the complete report output containing the heap
summary as well as the details to the specified file.
info heap <filename>
Displays detailed information about the specified heap
allocation including the allocation call stack.
info heap <idnumber>
Reports the heap allocations that exceed the specified
number, <num>, of bytes based on the cumulative number
set heap-check min-heap-size <num>
of bytes that are allocated at each call-site inclusive of
multiple calls to malloc() at a particular call site. See
Example 1 (page 13) for more information.
To obtain a snapshot heap profile, complete the following steps:
1. Run the debugger and load the program by entering the following command at command
prompt:
$ gdb <executable> <arguments>
(gdb) set heap-check on
NOTE: The set heap-check on command enables the memory-debugging feature in
WDB. This enables the detection of leaks, heap profiles, bounds checking, checking for double
free
2. Set a breakpoint by entering the following command:
(gdb) b <probepoint>
3. Run the program by entering the following command:
(gdb)run
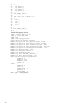
4. When the program is stopped at a breakpoint, enter the following info heap command:
(gdb) info heap
The following output is displayed:
Analyzing heap ...done
Actual Heap Usage:
Heap Start = 0x40408000
Heap End = 0x4041a900
Heap Size = 76288 bytes
Outstanding Allocations:
41558 bytes allocated in 28 blocks
No. Total bytes Blocks Address Function
0 34567 1 0x40411000 foo()
1 4096 1 0x7bd63000 bar()
2 1234 1 0x40419710 baz()
3 245 8 0x404108b0 boo()
[...]
Memory-Debugging Features of WDB 11