Debugging Dynamic Memory Usage Errors Using HP WDB HP Part Number: 5900-2181 Published: August 2012 Edition: 8
© Copyright 2007-2012 Hewlett-Packard Development Company, L.P Legal Notices The information in this document is subject to change without notice. Hewlett-Packard makes no warranty of any kind with regard to this manual, including, but not limited to, the implied warranties of merchantability and fitness for a particular purpose.
Contents Introduction..............................................................................................................................5 Intended Audience....................................................................................................................5 Typographic Conventions...........................................................................................................5 Related Information.............................................................................
Overriding the Configuration File Settings.........................................................................53 Printing Hexadecimal Address of Functions in Allocating Stack Traces Produced in Batch Mode Heap or Leak Report.....................................................................................................54 Debugging in Batch Mode.............................................................................................54 Debugging Multiple Applications in Batch Mode ..............
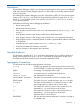
Introduction HP Wildebeest Debugger (WDB) is an HP-supported implementation of the open source debugger GDB. Apart from the normal debugging functions, it also enables you to debug memory-related errors in a program. HP WDB supports memory-debugging (using Run Time Checking (RTC)) of source-level programs written in HP C, HP aC++, and Fortran 90 on Itanium®-based systems running HP-UX 11i v2, or HP-UX 11i v3, and PA-RISC systems running HP-UX 11.
NOTE A note contains additional information to emphasize or supplement important points of the main text. Related Information The HP WDB documentation is available at the following location: /opt/langtools/wdb/doc/ Table 1 lists the documentation available for WDB. Table 1 Documentation for HP WDB Document Location Debugging with GDB /opt/langtools/wdb/doc/gdb.pdf GDB Quick Reference Card /opt/langtools/wdb/doc/refcard_a4.pdf /opt/langtools/wdb/doc/refcard_a3.df /opt/langtools/wdb/doc/refcard.
library routines. For more information on the dependent standard library routines, see the HP WDB release notes, available at the HP WDB Documentation website at: http://www.hp.com/go/wdb Memory-Related Errors This section discusses the following memory-related errors that can occur in an application: • Heap corruption • Memory leaks • Access errors Heap Corruption A heap corruption occurs when an application erroneously overwrites some of the data in the heap.
When the memory consumed by the application exceeds the resource limits set by the kernel, the application fails with out-of-memory errors. WDB enables you to detect out-of-memory conditions through runtime memory checking. It also enables you to simulate out-of-memory conditions in an application to understand application behavior under such conditions.
• When a stray pointer overflows the bounds of a heap block, or tries to access a heap block that is already freed to cause buffer overruns and under-runs • When reading or writing to memory locations that are already freed in the program NOTE: WDB provides minimal support for debugging some of the memory access errors. The scrambling feature and detection for out-of-bounds writes are supported by WDB.
For more information on the HP aC++ compiler options for memory debugging, see the HP C World Wide Webpage at: http://www.hp.com/go/c Memory Checking Analysis for User Defined Memory Management Routines Many user applications have their own memory management routines. These custom allocator routines are either user defined or sometimes wrappers to the default memory management routines. Memory checking features have been extended for user defined memory management routines.
Snapshot Profile The snapshot profile displays the outstanding heap allocations at a specific instant (probe point) at runtime. It does not display the blocks that are already freed before the probe point. Table 4 lists the basic commands used for heap profiling. Table 4 Commands for Heap Profiling Command Description info heap Displays the heap report that includes the current heap allocations, the sizes of the blocks allocated, and number of allocation instances.
5. To view a specific allocation, specify the allocation number as an argument to the info heap command. For example: (gdb) info heap 1 4096 bytes at 0x7bd63000 (9.86% of all bytes allocated) in bar () at test.c:108 in main () at test.c:17 in _start () in $START$ () NOTE: To get the latest heap allocation details for a particular block number , you must first enter the info heap command followed by info heap .
Example 1 Filtered Heap Reporting for Allocations Exceeding at a Particular Call-Site Sample Program 1 2 3 4 5 6 7 8 9 10 11 12 #include #include main() { int i, *arr[1000]; for (i=0; i < 1000; i++) arr[i] = malloc (49); malloc (30); set_brkpt_here(0) exit(0); } Sample Debugging Session $ gdb minheap (gdb) b set_brkpt_here (gdb) set heap-check min-heap-size 31 (gdb) run (gdb) info heap Analyzing heap ... 49000 bytes allocated in 1000 blocks No.
Example 2 Incremental Heap Profile Sample Program $ cat testincremental.c 1 #include 2 #include
61 62 63 64 65 66 67 68 69 70 71 72 73 74 75 76 /* 4 (3 old and 1 new) interval records; as the repeat count of 100 has been exceeded. */ marker1(); /* set repeat count to 500 */ for (repeat = 0; repeat < 2; repeat++) for (i = 0; i < 2; i++) { func3(); sleep (1); } marker1(); exit(0); } Sample Debugging Session (gdb) file testincremental Reading symbols from testincremental.. done.
Arena Profile WDB enables you to view the high-level memory-usage statistics of a running application. You can analyze the memory-usage statistics to understand the memory consumption, the allocation pattern, and the heap-fragmentation of the application.
can tune malloc() to use a specific ratio of small and ordinary blocks and reduce heap-fragmentation. The holding block headers and node blocks are used for the internal data-structure and bookkeeping in malloc(). The sum of the total bytes in holding block headers and node blocks determines the efficiency of malloc(). The memory allocator is more efficient when it uses less memory for the internal data-structure and bookkeeping.
Number Number Number Number Number Number 18 of of of of of of bytes in holding block header: 912 small blocks: 3500 ordinary blocks: 9 holding blocks: 35 free ordinary blocks: 1 free small blocks: 388
Example 3 Monitoring memory usage in an arena Sample Program $ cat malloc_1.c 1 /* test large malloc. 2 * corruption. 3 */ 4 #include 5 #include
61 { 62 f4_small(); 63 f1_small(); 64 f2_small(); 65 f3_small(); 66 } 67 set_brkpt_here(); 68 69 for (int i=0; i<1000; i++) 70 { 71 f4(); 72 f1(); 73 f2(); 74 f3(); 75 76 } 77 set_brkpt_here(); 78 } Sample Debugging Session (gdb) -leaks malloc_1.
(gdb) info heap arenas num_arenas: 1 expansion: 4096 Arena ID: 0 Total number of blocks in arena: 47 Start address: 0x4001003c Ending address: 0x40480ffc Total space: 4657088 Number of bytes in free small blocks: 69216 Number of bytes in used small blocks: 199584 Number of bytes in free ordinary blocks: 2480 Number of bytes in used ordinary blocks: 4375600 Number of bytes in holding block header: 912 Number of small blocks: 3500 Number of ordinary blocks: 9 Number of holding blocks: 35 Number of free ordina
Table 7 Commands for Leak Profiling (continued) Command Description This command also enables you to reduce performance degradation. See “Settings to Manage Performance Degradation” (page 48) To view the leak profile, complete the following steps: 1. Run the debugger and load the program by entering the following command: $ gdb or $ gdb –leaks 2.
Error Injection WDB supports error injection features to debug out-of-memory events in an application. It enables you to simulate out-of-memory conditions in an application and analyze the behavior of the applications under such conditions. In addition, it enables you to gain control over program execution when an out-of-memory event occurs. To simulate an out-of-memory condition, you must use the set heap-check null-check command to force malloc() to return NULL after or a random number of allocations.
Example 4 Simulating out-of-memory conditions after allocations Sample Program bash-2.05b$ cat null-check.c 1 #include 2 #include
Breakpoint 2, test_null_check () at null-check.c:19 19 printf("Out of memory scenario simulated\n"); (gdb) bt #0 test_null_check () at null-check.c:19 #1 0x2c70 in main () at null-check.c:25 #2 0x70ee3478 in _start+0xc0 () from /usr/lib/libc.2 (gdb) c Continuing. Out of memory scenario simulated Program exited normally.
Example 5 Simulating out-of-memory conditions after bytes are allocated Sample Program $ cat null-check.c 1 #include 2 #include
(gdb) c Continuing. warning: Malloc is returning simulated 0x00000000 value 0x70e78e8c in __rtc_nomem_event+0x4 () from /opt/langtools/lib/librtc.sl (gdb) bt #0 0x70e78e8c in __rtc_nomem_event+0x4 () from /opt/langtools/lib/librtc.sl #1 0x70e7b554 in handle_null_check+0x134 () from /opt/langtools/lib/librtc.sl #2 0x70e7b614 in malloc+0xb4 () from /opt/langtools/lib/librtc.sl #3 0x2c04 in test_null_check () at null-check.c:17 #4 0x2c70 in main () at null-check.
Example 6 Simulating out-of-memory conditions after a random number of allocations Sample Program bash-2.05b$ cat null-random.c 1 #include 2 #include 3 4 int main() 5 { 6 int i; 7 char *a; 8 for (i=0; i <= 500; i++) { 9 a = malloc(100); 10 if (a == NULL) 11 { 12 printf("Out of memory simulated\n"); 13 } 14 } 15 exit (0); 16 } Sample Debugging Session $ /opt/langtools/bin/gdb HP gdb 5.5.0 for PA-RISC 1.1 or 2.0 (narrow), HP-UX 11.00 and target hppa1.1-hp-hpux11.00.
Breakpoint 2, main () at null-random.c:12 12 printf("Out of memory simulated\n"); (gdb) p i $2 = 110 (gdb) c Continuing. Out of memory simulated warning: Malloc is returning simulated 0x00000000 value 0x70e78e8c in __rtc_nomem_event+0x4 () from /opt/langtools/lib/librtc.sl Event Monitoring The event monitoring commands in WDB enable you to monitor specific heap events and heap-corruption problems in an application.
Example 7 Monitoring a specific address Sample Program bash-2.05b$ cat watch-addr.c 1 #include 2 3 void enable_watch(char *cp) 4 { 5 6 } 7 8 int main() 9 { 10 char *cp = (char*)malloc(100); 11 enable_watch(cp); 12 free(cp); 13 exit(0); 14 } Sample Debugging Session $ /opt/langtools/bin/gdb HP gdb 5.5.0 for PA-RISC 1.1 or 2.0 (narrow), HP-UX 11.00 and target hppa1.1-hp-hpux11.00. Copyright 1986 - 2001 Free Software Foundation, Inc. Hewlett-Packard Wildebeest 5.5.
Monitoring Allocations Greater Than a Specified size The set heap-check block-size command instructs WDB to stop the program and transfer the execution control to the user when the program allocates a heap block whose size is greater than or equal to . Following is the syntax for the set heap-check block-size command: set heap-check block-size Example 8 (page 32) illustrates the use of the set heap-check block-size command.
Example 8 Monitoring allocations greater than a specified size Sample Program bash-2.05b$ cat block-size.c 1 #include 2 3 int main() 4 { 5 char * cp; 6 printf("Start of the program\n"); 7 cp = (char *)malloc(1024 *1024*10); 8 free (cp); 9 exit(0); 10 } Sample Debugging Session bash-2.05b$ /opt/langtools/bin/gdb HP gdb 5.5.0 for PA-RISC 1.1 or 2.0 (narrow), HP-UX 11.00 and target hppa1.1-hp-hpux11.00. Copyright 1986 - 2001 Free Software Foundation, Inc. Hewlett-Packard Wildebeest 5.5.
Example 9 Monitoring program heap growth Sample Program bash-2.05b$ cat heap-size.c 1 #include 2 3 int main() 4 { 5 char * cp; 6 printf("Start of the program\n"); 7 cp = (char *)malloc(1024 *1024*10); 8 free (cp); 9 cp = (char *)malloc(1024 *1024*8); 10 free (cp); 11 exit(0); 12 } Sample Debugging Session bash-2.05b$ /opt/langtools/bin/gdb HP gdb 5.5.0 for PA-RISC 1.1 or 2.0 (narrow), HP-UX 11.00 and target hppa1.1-hp-hpux11.00. Copyright 1986 - 2001 Free Software Foundation, Inc.
the break value. Most implementations of malloc() do not decrease the heap size when the memory is freed. The break value is indicative of the memory consumption by the program. Table 10 lists the commands that support the high water mark feature.
Example 10 High Water-Mark Feature Sample Program $cat high.c 1 #include 2 #include
40 }; (gdb) info heap high-mem Analyzing heap ... High memory mark stat High water mark updated count: 2 No. Total bytes 0 100 (gdb) Blocks 1 Address 0x4044ff20 Function func2() Case 2: The set heap-check high-mem-count command stops execution when the break value has moved of times. $ gdb high HP gdb 5.6 for HP Itanium (32 or 64 bit) and target HP-UX 11.2x. Copyright 1986 - 2001 Free Software Foundation, Inc. Hewlett-Packard Wildebeest 5.5.
Table 11 Commands for Monitoring Heap Corruption (continued) Command Description NOTE: HP WDB 6.0 and later versions of the debugger improves performance of memory debugging when the string option is set for 32-bit applications on HP-UX 11i v2 and later Integrity systems. However, the performance degrades for 64-bit applications on HP-UX 11i v2 and later Integrity systems.
Example 11 Monitoring heap-corruption caused by erroneous handling of string functions Sample Program bash-2.05b$ cat string.c 1 #include 2 3 int main() 4 { 5 char *ptr, *ptr1; 6 7 ptr = (char*)malloc(10); 8 ptr1 = (char *)malloc(20); 9 10 strcpy(ptr, "Hello"); 11 strcpy(ptr1, "Welcome to HP WDB"); 12 13 memcpy(ptr+5,ptr1,10); 14 } Sample Debugging Session bash-2.05b$ /opt/langtools/bin/gdb string HP gdb 5.5.0 for PA-RISC 1.1 or 2.0 (narrow), HP-UX 11.00 and target hppa1.1-hp-hpux11.00.
The set heap-check bounds command toggles the bounds-checking feature in WDB. When bounds-checking is enabled, WDB allocates extra space (guard bytes) at the beginning and end of a block during allocation and fills this space with a specific pattern. When the blocks are freed, the debugger verifies if the patterns are intact. If the patterns are corrupted, the debugger detects underflow or overflow errors and reports the corruption. Example 12 (page 40) illustrates the bounds-checking feature.
Example 12 Bounds-checking to detect out-of-bounds writes Sample Program bash-2.05b$ cat bounds.c 1 #include 2 3 int main() 4 { 5 char *cp = (char*)malloc(100); 6 cp[-1] = 100; 7 strcpy(cp,"Hello"); 8 cp[100] = 100; 9 free(cp); 10 exit(0); 11 } Sample Debugging Session bash-2.05b$ gdb bounds HP gdb 5.5.0 for PA-RISC 1.1 or 2.0 (narrow), HP-UX 11.00 and target hppa1.1-hp-hpux11.00. Copyright 1986 - 2001 Free Software Foundation, Inc. Hewlett-Packard Wildebeest 5.5.
0x70e78d7c in __rtc_event+0 () from /opt/langtools/lib/librtc.sl (gdb) f 4 #4 0x4000960:0 in main () at bounds.c:9 9 free(cp); (gdb) Setting the amount of guard bytes for every block of allocated memory HP WDB enables you to programmatically control the size of guard bytes for every block of the allocated memory. You can use these guard bytes to spot very rare and non-trivial boundary (buffer over-run and buffer under-run) corruptions.
Example 13 Detecting heap corruption using the info corruption command Sample Program $cat infobounds.c 1 #include 2 #include
2 10 1 0x40012520 sm_malloc() (gdb) info corruption 2 10 bytes at 0x40012520 (33.33% of all bytes allocated) #0 sm_malloc() at infobounds.c:12 #1 main() at infobounds.c:21 #2 main_opd_entry() from /usr/lib/hpux32/dld.so (gdb) Sample output that displays the in-block corruption of freed blocks: info corruption Analyzing heap ... Following blocks appear to be corrupted No.
NOTE: • To get the latest dangling pointers and dangling blocks details for a particular block number , you must first enter the info dangling command followed by info dangling . • WDB tries to help as much as possible to detect if these pointers are of type datum or real pointers.
Example 14 Scrambling a memory block on de-allocation Sample Program $ cat scramble.c 1 #include 2 #include 3 4 int 5 main () 6 { 7 char **tp; 8 tp = malloc (100); 9 printf ("Batch RTC test over, *tp=%p.\n", *tp); 10 fflush(stdout); 11 free(tp); 12 exit (0); 13 } Sample Debugging Session $ gdb scramble HP gdb 5.5 for PA-RISC 1.1 or 2.0 (narrow), HP-UX 11.00 and target hppa1.1-hp-hpux11.00. Copyright 1986 - 2001 Free Software Foundation, Inc. Hewlett-Packard Wildebeest 5.5.
NOTE: This feature is currently supported only for batch-mode of memory debugging on HP Integrity systems. Currently, only the files opened/closed using the following library calls are monitored: • open() • close() • creat() • dup() • dup2() • fopen() • fclose() • freopen() • fcntl() Table 12 Command for Reporting Open Files 46 Command Description check_openfd=[on|off] Enable/Disable the detection of open file descriptors.
Example 15 A sample c program and its openfd report obtained using wdb batch mode Sample Program 1 2 3 4 5 6 7 8 9 10 11 12 13 14 15 16 17 18 19 20 21 22 23 24 25 26 27 28 29 30 #include #include #include
File Name : File Descriptor : File Type : /tmp/textfile 4 Regular type Stack-trace :#0 func()() at do_fopen.c:23 #1 main() at do_fopen.c:10 #2 main_opd_entry() from /usr/lib/hpux32/dld.so The report as illustrated in the example above provides the summary and details of the open files separately. The summary first shows the total number of files that were open when the application exited. The first three entries are for standard input, output, and error, so they can be ignored.
2. To activate the memory debugging, perform either of the following: • Invoke WDB with the -leaks option as follows: $ gdb -leaks This enables leak checking. To enable other memory debugging features you must use the appropriate set of commands. • Alternatively, enter the following command at the gdb prompt: $ gdb (gdb)set heap-check on This enables leaks checking, bounds checking, and check for double-frees. 3.
Pre-loading the Appropriate Version of librtc.[sl|so] Along With the Application The appropriate version of the librtc.[sl|so] runtime library must be preloaded to enable batch mode and attach mode memory debugging of an application. You can explicitly preload librtc.[sl|so] from the appropriate path by using the LD_PRELOAD environment variable. Alternately you can use the +rtc option for the chatr command to automatically preload librtc.[sl|so].
NOTE: If LD_PRELOAD and chatr +rtc are used to preload the librtc.[sl|so] runtime library, librtc[sl|so] is loaded from the path specified by LD_PRELOAD. Overriding the Default Location for librtc.[sl|so] By default WDB uses the librtc.[sl|so], available at the location /opt/langtools/lib. If the application requires the use of librtc.[sl|so] at a different location, you must set the environment variable, LIBRTC_SERVER, to point to the location where the library is located.
Configuration File for Batch Mode Debugging You can set your preferences for batch mode memory-debugging by setting the parameters in the configuration file. The following sections discuss the location of the configuration file and the supported variables. Location of the Configuration File for Batch Mode Debugging The configuration file rtcconfig for batch mode debugging is user-defined.
NOTE: It is incorrect to use spaces before or after the ’=’ symbol in the batch mode configuration options in the configuration file, rtcconfig. Additionally, it is incorrect to use spaces before the batch mode configuration options.
Printing Hexadecimal Address of Functions in Allocating Stack Traces Produced in Batch Mode Heap or Leak Report From librtc 6.1 onwards, export the environment variable RTC_PRINT_ADDR to 1 to enable printing of hexadecimal address of functions in allocating stack traces. By default, the batch mode heap or leak report does not show the hexadecimal address for allocating stack traces.
4. You can use the +rtc option for the chatr command to automatically preload librtc.[sl|so] or you can explicitly preload librtc.[sl|so] from the appropriate path by using the LD_PRELOAD environment variable. NOTE: The +mem_check option for the chatr command is available for dynamic linker versions B.11.61 and later on HP 9000 systems, and dynamic linker versions B.12.46 and later on Integrity systems.
Example 16 Batch Mode Debugging for a 32-bit Application running on Itanium Sample Program $ cat memtest.c 1 #include 2 #include 3 #include 4 5 #include
(3) (4) (5) [/opt/langtools/lib/hpux32/librtc.sl] 0x60000000cac17200 __rtc_free + 0x160 at ../../../Src/gnu/gdb/infrtc.c:2977 [/opt/langtools/lib/hpux32/librtc.sl] 0x0000000004000bc0 main + 0x230 at memtest.c:25[memtest] 0x60000000c0029000 main_opd_entry + 0x50[/usr/lib/hpux32/dld.so] $ cat .//memtest.8494.leaks 40 bytes leaked in 10 blocks No.
4. Complete one of the following steps to preload librtc.[sl|so]: • Use the +rtc option for the chatr command on each of the required executable files that must be instrumented, as follows: $ chatr +rtc enable exec1 exec2 exec3 The +rtc option for the chatr command is available for dynamic linker versions B.11.66 and later on HP 9000 systems, and dynamic linker versions B.12.51 and later on Integrity systems. (Or) • Preload librtc.
$ chatr +rtc NOTE: To preload from a path that is different from the default paths, you must use the LD_PRELOAD environment variable. • Instead of automatically preloading librtc and mapping the shared libraries, you can explicitly preload the required librtc library. Set the environment variable, LD_PRELOAD as follows: ◦ For 32-bit applications running on Itanium, LD_PRELOAD=/opt/langtools/lib/hpux32/librtc.
Table 16 Commonly Used Commands for Memory Debugging (continued) Description Interactive Mode/Attach Mode Batch Mode Enables you to scramble blocks. set heap-check scramble set heap-check scramble Enables you to check for out-of-bounds set heap-check bounds corruption when the block is freed.
Table 16 Commonly Used Commands for Memory Debugging (continued) Description Interactive Mode/Attach Mode Batch Mode starts a fresh collection. The interval is specified in seconds. Enables you to specify the number of intervals for which WDB must collect the incremental heap growth. The default value is 100. Every repeat of the interval tracks heap allocation during that interval. set heap-check repeat Not supported in Batch Mode Creates a detailed report of the heap info heap interval growth.
• Stops if the following block address is allocated or de-allocated • Stops program execution when an allocation causes heap growth exceeding bytes • Collects memory leak data (equivalent to info leak) and memory-usage (equivalent to info heap) data WDB GUI supports both interactive and attach mode of memory-debugging. It does not support the batch mode debugging of applications. The source window in the WDB GUI displays the source code.
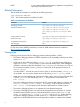
6. 7. Select View->Memory Usage->Incremental Heap to view the incremental heap profile. The Incremental Heap View window displays the incremental heap profile graph for the program The incremental heap profile graph can be plotted based on the outstanding allocations in the program or the actual heap profile, as follows: • To view the incremental heap profile graph based on the outstanding allocations, select the Allocation option in the Plot Graph frame.
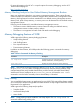
Figure 1 Allocation Profile 64
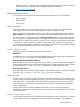
Figure 2 Heap Space Profile Figure 3 Incremental Heap Profile Summary Arena Profiling Using WDB GUI HP WDB GUI 5.7 and later versions provide support to view the arena information for a program running on HP-UX 11i v3.
1. 2. 3. Load the program to HP WDB GUI. Stop the program execution at the required breakpoints. Select View->Memory Usage->Heap Arena to view the arena information. The arena information is displayed in the View Heap Arena window. The following information is displayed in the View Heap Arena window: • Arenas The Arena IDs are listed in the Arenas list menu. Select the required Arena ID from the Arenas list menu to view Arena ID Summary, or Block Details for the selected arena.
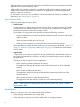
The number of blocks that are distributed across the used ordinary blocks, the used small blocks, the free ordinary blocks, and the free small blocks are displayed for each arena. This information is displayed as a bar graph for each arena. The number of blocks occupied by the used ordinary blocks, the used small blocks, the free ordinary blocks, and the free small blocks across the arenas are displayed in a pie chart. This information is also displayed in a table.
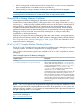
Figure 5 View Heap Arena Window 2 Figure 6 Arena Summary 68
Figure 7 Arena Block Distribution Step by Step Approach for Detecting Leaks This section provides the guidelines and a sample test case to enable you detect memory leaks by going through a step by step procedure. Steps to Detect Point of Memory Leak To detect the point of memory leak, ensure that you go through following steps: 1. Enable memory leak detection for the application run and collect the leak report in batch mode. To enable leak detection, use check_leaks=on in the rtcconfig file. 2.
Sample Test Case to Detect Point of Memory Leak The “Steps to Detect Point of Memory Leak” (page 69) are represented through a sample test case. The sample test case is provided as shown below: 1 2 3 4 5 6 7 8 9 10 11 12 13 14 15 16 17 18 19 20 21 22 23 24 25 26 27 28 29 30 31 32 33 34 35 36 37 38 39 40 41 42 43 44 45 46 47 48 49 50 51 52 53 54 55 56 57 58 59 60 70 #include #include #include
61 62 63 64 65 66 67 68 69 70 71 72 73 74 75 76 77 78 79 80 81 82 83 84 85 86 87 88 89 90 91 92 93 94 95 96 97 98 99 100 101 102 103 104 105 } void compareStrings() { int s1length, s2length; char *str1 = NULL, *str2 = NULL; /* Allocate first string and initialize it */ do { printf("Enter length of string 1\n"); scanf("%d", & s1length); str1 = createString("String 1", s1length); } while (str1 == NULL); /* Allocate second string and initialize it */ do { printf("Enter length of string 2\n"); scanf("%d", & s
Example 17 Collecting memory leak report using batch mode To collect the memory leak report using batch mode, complete the following steps: a. Compile the source file. $ aCC -Ae -o memLeak -g memLeak.c b. Set the target application to preload the librtc runtime library, enter the following command at the HP-UX prompt: $ chatr +rtc enable memLeak c. Set an environment variable BATCH_RTC. If you are using the Korn or Posix shell, enter the following command at the HP-UX prompt: $ export BATCH_RTC=on d.
2. Detect the location of memory leak.
Example 18 Detecting the location of memory leak To detect the location of the first leak, follow the steps mentioned below: a. Execute the program under gdb with memory leak detection option using the command shown below: $ gdb -leaks memLeak HP gdb 6.0.3 for HP Itanium (32 or 64 bit) and target HP-UX 11iv2 and 11iv3. Copyright 1986 - 2009 Free Software Foundation, Inc. Hewlett-Packard Wildebeest 6.0.3 (based on GDB) is covered by the GNU General Public License.
(gdb) e. Step into the compareStrings() and collect leak information with the info leaks command. If the leak is reported, it displays that the pointer to the memory allocated in the allocateMemory() function is lost before getting into the compareStrings() function. (gdb) finish Run till exit from #0 0x4000f40:0 in createString ( input=0x4000bc0 "String 1", n=25) at memLeak.c:37 Too small size for a string, not allocating Number of badInput is 1 0x40012c0:0 in compareStrings () at memLeak.
Example 19 Detecting a double free error Sample Program $ cat double-free.c #include 1 2 int main() 3 { 4 5 printf("Starting program\n"); 6 char* han = (char*)malloc(sizeof(char)); 7 free(han); 8 printf("Now freeing a pointer twice...\n"); 9 free(han); 10 } Sample Debugging Session (gdb) set heap-check free on (gdb) file double-free Reading symbols from double-free...done. (gdb) b main Breakpoint 1 at 0x2be4: file double-free.c, line 5 from double-free.
Example 20 Detecting de-allocation of memory that has not been initialized Sample Program $ 1 2 3 4 5 6 7 8 cat unalloc.c #include int main() { printf("Starting program\n"); char* han; free(han); } Sample Debugging Session gdb) set heap-check on (gdb) file unalloc Reading symbols from unalloc...done. (gdb) b main Breakpoint 1 at 0x2bb4: file unalloc.c, line 5 from unalloc. (gdb) r Starting program: unalloc Breakpoint 1, main () at unalloc.
Example 21 Detecting de-allocation of un-allocated blocks Sample Program $ 1 2 3 4 5 6 7 8 9 cat unit.c #include int main() { printf("Starting program\n"); int *han = (int*)malloc(sizeof(int)); han++; free(han); } Sample Debugging Session (gdb) set heap-check on (gdb) file uninit Reading symbols from uninit...done. (gdb) b main Breakpoint 1 at 0x2bdc: file uninit.c, line 5 from uninit. (gdb) r Starting program: uninit Breakpoint 1, main () at uninit.
Example 22 Detecting memory leaks that are caused when an application overwrites a pointer that currently addresses a block of memory with another address or data Sample Program $ cat memleak1.c 1 #include 2 3 int main() { 4 5 printf("Starting program\n"); 6 int* han1 = (int*)malloc(sizeof(int)); 7 int* han2 = (int*)malloc(sizeof(int)); 8 han1 = han2; 9 free(han1); 10 } Sample Debugging Session (gdb) set heap-check on (gdb) file memleak1 Reading symbols from memleak1...done.
Example 23 Detecting memory leaks that are caused when a pointer variable in an application addresses memory that is out of the scope of the application Sample Program $ cat memleak2.c 1 #include
Example 24 Detecting memory leaks when you free a structure or an array that has pointers which are not freed. Sample Program $ cat memleak3.c 1 #include 2 3 struct stud 4 { 5 char* name; 6 int id; 7 }; 8 9 int main() { 10 11 struct stud *s1; 12 s1 = (struct stud*)malloc(sizeof(struct stud)); 13 s1->name = (char*)malloc(50); 14 strcpy(s1->name,"Annie"); 15 s1->id=10; 16 free(s1); 17 } Sample Debugging Session (gdb) set heap-check on (gdb) file memleak3 Reading symbols from memleak3...done.
Example 25 Work-Around when program execution is in a frame that belongs to the GDB internal leak detection library ... (gdb) set heap-check on (gdb) r Starting program: corruption warning: Memory block (size = 80 address = 0x40453970) appears to be corrupted at the end. Allocation context not found #1 main() at corruption.c:4 #2 main_opd_entry() from warning: Use command backtrace (bt) to see the current context. Ignore top 4 frames belonging to leak detection library of gdb. __rtc_event () at ../../..
NOTE: • This feature is not supported in the batch and the attach modes of debugging. • In interactive mode, this feature will result in calls to the user defined memory management routines being re-routed to default memory management routines. 6 Which version of WDB supports debugging of applications with custom allocators? WDB 5.5 and above versions support the debugging of applications with custom allocators. 7 Does WDB report the exact instant when the block becomes a leak? No.
(gdb) info corruption Current thread is inside the allocator. Try again later. This error message signifies that the program execution is in a frame that belongs to a GDB internal leak detection library. When this error is encountered, it is not safe to enter commands that involve calls to the leak detection library procedures. The user must set the frame to the last leak detection library frame and enter the finish command before resuming to debug memory.
Interactive Mode , 48 Interactive, Batch and Attach Mode , 48 L LD_PRELOAD, 50 Leak Profiling, 21 M Memory Leaks, 7 Memory Related Errors, 7 min-heap-size, 11 Monitoring Heap Events, 29 P Prerequisites for Memory Debugging, 6 R RTC_MALLOC_CONFIG, 53 S set heap-check block-size , 31 set heap-check bounds , 38 set heap-check frame-count , 48 set heap-check free , 36 set heap-check heap-size , 32 set heap-check high-mem-count , 33 set heap-check inter