
Debugging Dynamic Memory Usage Errors Using HP WDB (766161-001, March 2014)
2 100 1 0x405503f0 main()
3 100 1 0x40550460 main()
4 100 1 0x405504d0 main()
-------------------------------------------------------------------------
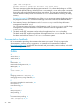
Detailed Report
-------------------------------------------------------------------------
8208 bytes at 0x4054caa0 (60.76% of all bytes allocated)
#0 _findbuf() at ../../../../../core/libs/libc/shared_em_32_perf/../core/stdio/flsbuf.c:328
#1 _wrtchk() at ../../../../../core/libs/libc/shared_em_32_perf/../core/stdio/flsbuf.c:262
#2 _printf() at ../../../../../core/libs/libc/shared_em_32_perf/../core/stdio/printf.c:35
#3 main() at sample_program.c:12
-------------------------------------------------------------------------
5000 bytes in 100 blocks (37.02% of all bytes allocated)
These range in size from 50 to 50 bytes and are allocated
#0 main() at sample_program.c:19
#1 main_opd_entry() from /usr/lib/hpux32/dld.so
-------------------------------------------------------------------------
100 bytes at 0x405503f0 (0.74% of all bytes allocated)
#0 main() at sample_program.c:22
#1 main_opd_entry() from /usr/lib/hpux32/dld.so
-------------------------------------------------------------------------
100 bytes at 0x40550460 (0.74% of all bytes allocated)
#0 main() at sample_program.c:23
#1 main_opd_entry() from /usr/lib/hpux32/dld.so
-------------------------------------------------------------------------
100 bytes at 0x405504d0 (0.74% of all bytes allocated)
#0 main() at sample_program.c:24
#1 main_opd_entry() from /usr/lib/hpux32/dld.so
-------------------------------------------------------------------------
FAQ
1 Does WDB report all the leaks in a program?
WDB uses a conservative leak detection algorithm. As a result, all leaks may not be reported,
but all reported leaks are definite leaks. WDB reports leaks only in the code path exercised
in the current run.
2 I wrote a small sample program that allocates a block using malloc() and leaks the block
immediately, by assigning NULL to the pointer, but WDB does not report this block as a leak.
Why?
This is attributed to the leak detection algorithm followed by WDB. If the datum in the program
address space masks a leak, the leak is not reported. In this case the address returned from
malloc() is stored in the architecture registers and consequently masks the leak. Typically,
if you call any function after the leak, such as a printf(), then WDB can catch the leak.
3 Does WDB support detection of leaks in a third party code?
Yes. WDB supports detection of leaks in a third party code also.
4 What are the commands that the batch mode of memory-debugging does not support?
For more information on the commands that are supported in batch mode, see “Summary of
Memory Debugging Commands” (page 66)
5 Can WDB debug applications with user-defined memory management routines?
WDB can debug applications with memory management routines that are either user defined
or are wrappers to the default memory management routines.
94