
Debugging Dynamic Memory Usage Errors Using HP WDB (766161-001, March 2014)
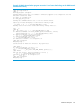

Example 19 Detecting the location of memory leak
To detect the location of the first leak, follow the steps mentioned below:
a. Execute the program under gdb with memory leak detection option using the command
shown below:
$ gdb -leaks memLeak
HP gdb 6.0.3 for HP Itanium (32 or 64 bit) and target HP-UX 11iv2 and 11iv3.
Copyright 1986 - 2009 Free Software Foundation, Inc.
Hewlett-Packard Wildebeest 6.0.3 (based on GDB) is covered by the
GNU General Public License. Type "show copying" to see the conditions to
change it and/or distribute copies. Type "show warranty" for
warranty/support.
..
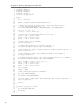
b. Insert a break at the function that allocates the memory.
In this case, the function allocateMemory() allocates the memory.
NOTE: Enter the same input given to the program while executing the program in batch
mode. In this case it is 25.
(gdb) b allocateMemory
Breakpoint 1 at 0x4000ce0:2: file memLeak.c, line 8 from /tmp/memLeak.
(gdb) run
Starting program: /tmp/memLeak
Enter length of string 1
25
Breakpoint 1, allocateMemory (n=20) at memLeak.c:8
8 void *memBlock = NULL;
(gdb)
c. Step into the calling function and trace the behavior of the pointer pointing to the allocated
memory i.e. step into the createHeader() and collect leak information with the info
leaks command when the execution reaches this function.
NOTE: The leak information is not reported because the allocateMemory() function
has returned the pointer to the createHeader(). The headerString is pointing to
the allocated memory of size 20.
(gdb) finish
Run till exit from #0 allocateMemory (n=20) at memLeak.c:8
Allocating memory of size 20
0x4000e70:0 in createHeader () at memLeak.c:24
24 char *headerString = (char *) allocateMemory(20);
Value returned is $1= (void *) 0x400124a0
(gdb) info leak
Scanning for memory leaks...
No new leaks.
(gdb)
d. Step into the next calling function i.e. the createString() and collect leak information
with the info leaks command when the execution reaches there.
NOTE: The leak information is not shown as the hdrString is pointing to the allocated
memory of size 20.
(gdb) finish
Run till exit from #0 0x4000e70:0 in createHeader () at memLeak.c:24
0x4000f40:0 in createString (input=0x4000bc0 "String 1", n=25) at memLeak.c:37
37 hdrString = createHeader();
Value returned is $2= 0x400124a0 "Header : My string "
(gdb) info leak
Scanning for memory leaks...
No new leaks.
Step by Step Approach for Detecting Leaks 81