
Debugging Dynamic Memory Usage Errors Using HP WDB (766161-001, March 2014)
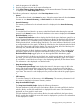


Example 18 Collecting memory leak report using batch mode
To collect the memory leak report using batch mode, complete the following steps:
a. Compile the source file.
$ aCC -Ae -o memLeak -g memLeak.c
b. Set the target application to preload the librtc runtime library, enter the following command
at the HP-UX prompt:
$ chatr +rtc enable memLeak
c. Set an environment variable BATCH_RTC. If you are using the Korn or Posix shell, enter
the following command at the HP-UX prompt:
$ export BATCH_RTC=on
d. Enable the leaks detection for the application run and get the call stack by setting the
check_leaks variable as shown below.
$ cat rtcconfig
check_leaks=on
e. Run the program.
$ ./memLeak
The output of ./memLeak is as shown below:
a. Enter length of string 1
25
Allocating memory of size 20
Too small size for a string, not allocating
Number of badInput is 1
b. Enter length of string 1
35
Allocating memory of size 20
Allocating memory of size 35
c. Enter length of string 2
35
str1 <= str2
warning: Memory leak info is written to "memLeak.5944.leaks".
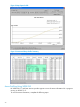
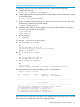
The memory leak report produced by batch rtc file is as shown below:
20 bytes leaked in 1 blocks
No. Total bytes Blocks Address Function
0 20 1 0x40061a00 allocateMemory()
-------------------------------------------------------------------------
Detailed Report
-------------------------------------------------------------------------
20 bytes leaked at 0x40061a00 (100.00% of all bytes leaked)
#0 0x04000d62 allocateMemory() at memLeak.c:11
#1 0x04000e62 createHeader() at memLeak.c:24
#2 0x04000f32 createString() at memLeak.c:37
#3 0x040012b2 compareStrings() at memLeak.c:74
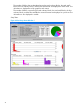
After knowing the memory leak information in the application through batch mode, select the
leaks one by one and follow the procedure mentioned below.
Step by Step Approach for Detecting Leaks 79