
Debugging Dynamic Memory Usage Errors Using HP WDB (766161-001, March 2014)
Debugging Memory Using WDB GUI
The WDB GUI is a Graphical User Interface (GUI) designed by Hewlett-Packard for WDB. It can
be used to debug native-compiled HP C, HP aC++, and Fortran programs on Itanium-based systems
running HP-UX 11i v2 or HP-UX 11i v3, and PA-RISC systems running HP-UX 11.0, HP-UX 11i v1,
HP-UX 11i v2, or HP-UX 11i v3.
The WDB GUI offers the following capabilities to debug memory–related errors in an application
• Detects corruption caused by calls to strcpy(), memset(), and memcopy()
• Stops program-execution at free of an unallocated or de-allocated block address
• Stops program-execution when block is freed if bad writes occur before or after block bounds
• Scrambles previous memory contents on malloc() or free() calls
• Stops if the following block address is allocated or de-allocated
• Stops program execution when an allocation causes heap growth exceeding <num> bytes
• Collects memory leak data (equivalent to info leak) and memory-usage (equivalent to info
heap) data
WDB GUI supports both interactive and attach mode of memory-debugging. It does not support
the batch mode debugging of applications.
The source window in the WDB GUI displays the source code. The command window displays
the output after debugging the application. It also enables you to use the command-line interface
in WDB. The command window can be used to take advantage of memory-debugging features
that are not directly supported in the GUI.
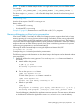
Using WDB GUI to Debug Memory-Related Problems
To debug an application for memory problems using WDB GUI, complete the following steps:
1. Load the program to WDB as follows:
• Select File —> Load Program in the WDB GUI window.
• In the Load Program dialog-box, enter the executable name to load the executable or use
the PID to attach a process for debugging.
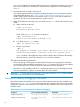
2. After you load the application, you can set the memory checking preferences by setting the
preferences in the Memory Checking window. Select Tools —>Memory Checking to activate
the Memory Checking window.
3. To set a break-point using WDB GUI, click the rectangular selection strip adjacent to the
specific program line-number in the source window. When the breakpoint is set, a red
octagonal button appears at the specified probe-point. Alternatively, you can set breakpoints
by selecting Edit —>Breakpoints and specifying the breakpoints in the Breakpoints window.
4. Run the application. WDB GUI now gives you the leaks usage, memory-usage and the results
of memory checking at the specified break-points.
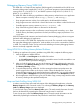
Heap and Leak Profiling Using WDB GUI
In order to view the heap report and leak reports while debugging the application, select the
Memory Usage tab in the command window. On selecting the Memory Usage tab, the Memory
Leaks and Memory Usage options are displayed.
To view the leak report, select the Memory Leaks option. The stack-unwind information for each
leak can be obtained by expanding the enhanced array browser for each leak.
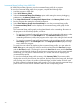
To see a heap report, select the Memory Usage option. The stack-unwind information can be
obtained by expanding the enhanced array browser for each block of the heap.
Debugging Memory Using WDB GUI 69