
Debugging Dynamic Memory Usage Errors Using HP WDB (766161-001, March 2014)

Librtc thus loaded, first initializes itself and then finds out all the prior allocations to record
them. All new allocation or de-allocation requests from the application will be captured by
librtc.
2. Generate the memory heap or leak reports:
Use nudge triggered memory reporting to generate the reports. For more information about
nudge triggered reporting, see “Nudge/Signal Triggered Batch Mode Reporting” (page 57)
section. Send signal to the process as specified in the rtcconfig file and the reports are
generated. The reports can be generated any number of times.
3. Attach HP WDB to the running process, turn off the dynamic-rtc feature and detach or quit
WDB:
a. Attach WDB to the process:
$ gdb -q -p 10764
Attaching to process 10764
...
Check if the dynamic-rtc feature is currently on:
(gdb) show dynamic-rtc
Dynamic run time memory checking is on.
b. Turn off the dynamic-rtc feature
(gdb) set dynamic-rtc off
c. Detach or quit WDB:
(gdb) q
The program is running. Quit anyway (and detach it)? (y or n) y
Detaching from program: /user/xyz/…/test-case, process 10764
Librtc loaded in the application stops capturing further data and flushes off internally
allocated memory. Once that is done the librtc itself is unloaded.
This feature has the following limitations:
• The memory heap or leak reports as obtained by this feature do not provide the stack-trace
for those blocks allocated before turning the dynamic-rtc feature ON. They are not clubbed
into a single entry even if such prior blocks are allocated with same stack-trace.
• This feature is only available on HP-UX 11i v3 operating system running on HP Integrity systems.
You must install PHCO_43464 libc library patch to use this feature.
IMPORTANT: This feature should not be used in conjunction with other librtc modes like batch
mode, API mode, and should be used independently.
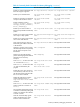
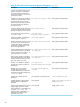
Summary of Memory Debugging Commands
Most of the commands available in the interactive and the attach modes are also available in the
batch mode. Table 16 (page 66) lists the commands that are available in the batch mode and the
equivalent commands in the interactive mode. It also lists the commands that are not supported in
the batch mode.
Table 16 Commonly Used Commands for Memory Debugging
Batch ModeInteractive Mode/Attach ModeDescription
set heap-check <on/off>set heap-check <on/off>Enables heap profiling
set heap-check leaks <on/off>set heap-check leaks
<on/off>
Enables you to detect leaks.
66