
Debugging Dynamic Memory Usage Errors Using HP WDB (766161-001, March 2014)
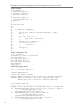

Example 17 Monitoring memory usage from core file
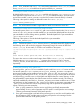
$ cat sample.c
1 #include <stdlib.h>
2
3 int *dptr;
4 int * lptr;
5 void fun()
6 {
7 lptr = (int *) malloc(210021);
8
9 /* Due to second allocation, first allocation to lptr is leaked.*/
10 lptr = (int *) malloc(210021);
11
12 /* Due to third allocation, second allocation to lptr is leaked.*/
13 lptr = (int *) malloc(210021);
14 }
15
16
17 int main()
18 {
19 int x=0, y;
20
21 fun();
22
23 dptr = (int *) malloc(1024);
24 free(dptr); /* dptr becomes dangling pointer */
25
26 y=1/x; /* This will dump core */
27
28 return 0;
29 }
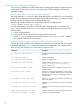
Sample Debugging Session
(gdb) file sample
Reading symbols from sample...done.
(gdb) core core
Core was generated by `sample'.
Program terminated with signal 8, Arithmetic exception.
FPE_INTDIV - integer divide by zero
#0 0x40015f0:1 in _divI () at ldiv.c:527
527 ldiv.c: No such file or directory.
in ldiv.c
(gdb) bt
#0 0x40015f0:1 in _divI () at ldiv.c:527
#1 0x4001410:0 in main () at sample.c:26
(gdb) info heap
Analyzing heap ...
Actual Heap Usage:
Heap Start = 0x40010060
Heap End = 0x4063a000
Heap Size = 6463392 bytes
Outstanding Allocations:
630063 bytes allocated in 3 blocks
No. Total bytes Blocks Address Function
0 210021 1 0x4059f5c0 fun()
1 210021 1 0x405d2a30 fun()
2 210021 1 0x40605ea0 fun()
(gdb) info leaks
60