
Debugging Dynamic Memory Usage Errors Using HP WDB (766161-001, March 2014)
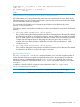

1. Compile the source files with the —g option. No special compilation of link options are required.
The program must be linked with shared libc.[so|sl]. Memory-checking features do not
work on the programs linked with archived libc.a
$ aCC –g <source filename> –o <executable>
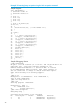
2. To activate the memory debugging, perform either of the following:
• Invoke WDB with the -leaks option as follows:
$ gdb -leaks <executable>
This enables leak checking. To enable other memory debugging features you must use
the appropriate set of commands.
• Alternatively, enter the following command at the gdb prompt:
$ gdb <executable>
(gdb)set heap-check on
This enables leaks checking, bounds checking, and check for double-frees.
3. Place breakpoints at probe points by entering the following command:
(gdb)b <probe_point>
4. To generate a leak profile at the breakpoint, enter the following command:
(gdb)info leaks <filename>
5. To generate a snapshot heap profile at the breakpoint, enter the following command:
(gdb) info heap <filename>
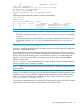
Debugging in Batch Mode
In this mode, the user does not interactively issue commands in a debugger session. Instead, the
memory-debugging commands are stored in a user-specified configuration file. The configuration
file gets processed during the run of the application and the memory reports, in the form of text
files, are generated at the end of the program run (when exit() is called) by the librtc library. On
Itanium from WDB 6.4 onwards, the generation of these memory report can be triggered at any
point in time during execution with the help of signal. These memory reports include three separate
output files for leaks report, heap profile and the memory corruption report.
NOTE: Librtc versions prior to 6.1 invokes the debugger to print the leak or heap data after
the application is stopped.
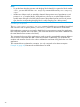
Following is the naming convention for the output files:
<file_name>.<pid>.<suffix>
Where:
<pid> is the process id and <suffix> can be either leaks, heap, or mem based on the type
of report.
For example: memtest.8494.mem
Environment Variables for Batch Memory-Debugging
This section discusses the environment variables that must be set for using the batch mode of memory
debugging.
Enabling and Disabling Batch Mode Memory-Debugging
The environment variable, BATCH_RTC, must be configured to enable and disable batch mode
memory-debugging.
Following is the syntax for enabling and disabling batch mode debugging:
export BATCH_RTC=<on/off>
Supported Modes of Memory-debugging in WDB 49