
Debugging Dynamic Memory Usage Errors Using HP WDB (766161-001, March 2014)

File Name : /tmp/textfile
File Descriptor : 4
File Type : Regular type
Stack-trace :-
#0 func()() at do_fopen.c:23
#1 main() at do_fopen.c:10
#2 main_opd_entry() from /usr/lib/hpux32/dld.so
The report as illustrated in the example above provides the summary and details of the open files
separately. The summary first shows the total number of files that were open when the application
exited. The first three entries are for standard input, output, and error, so they can be ignored.
However the fourth entry shows that a regular type file with name /tmp/textfile was still open
when the application exited. As you can see in the code, the file /tmp/textfile was also
opened with file-descriptor “3”, but since it was closed before the exit of application, it is not
reported. The detailed report provides the stack-trace information at the point when the application
opened the file. For convenience, the pattern of the report is kept similar to that of the existing leak
and heap reports.
Settings to Manage Performance Degradation
Memory-debugging slows down the performance of an application by 20-40% because of stack
unwinding. Reducing the number of stack frames the debugger collects for each allocation reduces
the performance degradation.
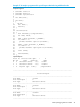
Table 13 lists the options for reducing the performance degradation.
Table 13 Options for Performance Improvement
DescriptionCommandSetting
Controls the depth of the call stack. By
default, num is set to 4.
set heap-check frame-count
<num>
Stack Depth
Specifies the minimum leak size for
stack trace collection. The debugger
set heap-check min-leak-size
<num>
Minimum Leak Size
continues to report leaks that are
smaller than <num> bytes, but it does
not provide the stack trace for the same.
By default, num is set to 0.
Supported Modes of Memory-debugging in WDB
WDB supports the following modes of memory-debugging:
• Interactive Mode
• Batch Mode
• Attach Mode
• RTC-API Mode
Debugging in the Interactive Mode
The interactive mode of memory-debugging is typically useful during the development and defect
fixing phase, where you need the flexibility to control the flow of program execution while debugging
memory related problems.
To debug your program in the interactive mode, complete the following steps:
48