
Debugging Dynamic Memory Usage Errors Using HP WDB (766161-001, March 2014)


Arena Profile
WDB enables you to view the high-level memory-usage statistics of a running application. You can
analyze the memory-usage statistics to understand the memory consumption, the allocation pattern,
and the heap-fragmentation of the application.
WDB enables you to view the following memory-usage statistics:
• High level memory-usage statistics of a process
• High level memory-usage statistics of each arena
• Block level and overall memory-usage statistics of each arena
• Block level and overall memory-usage statistics of each arena along with the allocated stack
trace for each allocated block.
NOTE: For more information on arenas, see the malloc(3c) manpages.
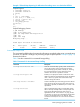
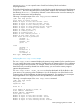
Table 6 lists the commands for monitoring memory-usage in an arena.
Table 6 Memory-Usage in an Arena
DescriptionCommand
Displays the high level memory-usage of a process. Lists
the number of free blocks, used blocks, small blocks,
holding blocks, node blocks and regular blocks.
info heap process
Displays the high level memory-usage details of the
specified arena <arena_id>. It also lists the number of
info heap arenas <arena_id>
free blocks, used blocks, small blocks, holding blocks and
regular blocks. If the <arena_id> is not specified, it
displays the memory-usage statistics for the current arena.
Displays the memory-usage statistics of all the blocks in the
given arena, in the increasing order of block-addresses.
info heap arenas <arena_id> blocks
Displays the memory-usage statistics of a specific block in
the arena with the stack trace for the specified arena and
block.
info heap arenas <arena_id> blocks
<block-id>
Displays the overall and block level memory-usage statistics,
with stack trace wherever applicable.
info heap arena <arena_id> blocks stacks
The info heap process and info heap arenas commands do not require re-linking or
rebuilding of the application. You can attach a running process to the debugger and get a snapshot
of the heap-profile of the process. Example 3 (page 19) illustrates the use of the info heap
process and info heap arenas commands.
NOTE:
• The info heap arenas and info heap process commands are not supported in batch
mode.
• The info heap process and info heap arenas are available only on HP-UX 11i v3.
• The stack trace is displayed only if memory debugging is enabled. (Enable the set
heap-check on command to enable memory debugging). If the stack trace is not required,
the memory-usage statistics can be viewed without enabling memory checking.
Analyzing the info heap process output
The info heap process command displays the number of used, free, small, holding, node
and regular (ordinary) blocks.
If there are a larger number of free small blocks, you can suspect heap-fragmentation. The
application does not differentiate between a small block and an ordinary block. However, you
16