
Debugging Core Files Using HP WDB

7. To determine the value of the variables, you must analyze the contents of the required
memory location.
In this example, the value of arg1 is an integer, and hence this value is 32(0x20).
The argument, arg0, is a pointer to a structure. To arrive at the value of arg0, the offsets
for the variables in the structure must be determined manually.
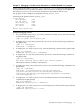
Following are the offsets for the variables in the structure st_one (in case of the PA-RISC
32–bit binary):
struct st_one {
int one; +0x0
char *two; +0x4
struct st_two *three; +0x8
int *four; +0xC
char *five; +0x10
};
Following are two methods to determine the values in the structure:
NOTE: If the debug information is available, these offsets can be displayed by using the
ptype -v struct st_one command.
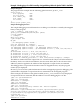
• Method 1:
In this method, the memory location of the fields in the structure st_one are calculated
by determining the offsets for each field relative to the address location of arg0. The
contents of the calculated address locations are displayed by using the x command.
The following debugging session illustrates how to determine the values in the structure,
st_one:
— To display the char* value at the second field in the structure, enter the following
command at the gdb prompt:
(gdb) x/x 0x7f7e6688+0x4
0x7f7e668c: 0x40001140
To display the string value at the displayed address, enter the following command
at the gdb prompt:
(gdb) x/s 0x40001140
0x40001140 <__d_trap_fptr+292>: "NOT!"
— To display the int* value in the fourth field, enter the following command at the
gdb prompt:
(gdb) x/x 0x7f7e6688+0xc
0x7f7e6694: 0x7f7e6688
To display the int value at this address, enter the following command at the gdb
prompt:
(gdb) x/x 0x7f7e6688
0x7f7e6688: 0x00000011
— To display the char* value at the last field in the structure, enter the following
command at the gdb prompt:
(gdb) x/x 0x7f7e6688+0x10
0x7f7e6698: 0x40001120
To display the char value at this address, enter the following command at the gdb
prompt:
(gdb) x/s 0x40001120
0x40001120 <__d_trap_fptr+260>: "The meaning"
— To display the address of the st_two structure, enter the following command at
the gdb prompt:
Examples Illustrating Core File Debugging 35