
Debugging Core Files Using HP WDB
0x2410 <function_abort+28>: stw %r22,4(%sr0,%r21)
0x2414 <function_abort+32>: ldil L'0x2000,%r31
0x2418 <function_abort+36>: be,l 0x3dc(%sr4,%r31)
0x241c <function_abort+40>: copy %r31,%rp
0x2420 <function_abort+44>: ldw -0x54(%sr0,%sp),%rp
0x2424 <function_abort+48>: bv %r0(%rp)
0x2428 <function_abort+52>: ldo -0x40(%sp),%sp
End of assembler dump.
If the parameters are not stored on the stack, the task of reading the core file is similar to
reading a kernel crash dump. In such cases, you must analyze the routines that are invoked
before the required function and check if the parameters are passed up the stack by these
routines. You must also check if these routines have saved the address or the value on the
stack.
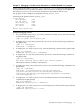
5. Analyze the assembler dump from the disassembly output.
The first four arguments for a function are passed through registers for PA-RISC 32–bit
binaries. However, the stack is not updated using these values. The invoked function saves
the arguments to the stack, if required. If the function parameters are not passed up the
stack, the value of the parameters are not available when you debug the core file.
You can analyze the following lines from the assembler dump to view information about
the function parameters:
0x23fc <function_abort+8>: stw %r26,-0x64(%sr0,%sp)
0x2400 <function_abort+12>: stw %r25,-0x68(%sr0,%sp)
These lines provide information about the location of the function parameters in the stack.
This calling convention for the function parameters is defined by the PA-RISC runtime
architecture.
In the case of Itanium architecture, the arguments are normally passed through the stacked
general registers, gr32, and gr33.
For example:
r26 == arg0, r25==arg1, r24==arg2, r23==arg3
The convenience variable, $sp, stores the stack pointer in WDB. The disassembly output
for the function displays the addresses of the arguments that are relative to the stack pointer.
Hence, arg0 is stored at $sp-0x64 on the stack and arg1 is stored at $sp-0x68.
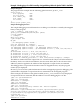
6. Examine the contents of the required memory location.
The x command enables you to examine the contents at a specified memory location.
You can use the x command to view the contents of arg0 at $sp-0x64, and arg1 at
$sp-0x68.
For example:
(gdb) x/x $sp-0x68
0x7f7e6738: 0x00000020
(gdb) x/x $sp-0x64
0x7f7e673c: 0x7f7e6688
34