
Debugging Core Files Using HP WDB
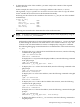
2. View the backtrace information to analyze the flow of routines in the program that resulted
in a program abort. The following backtrace information of the core file illustrates that
function_abort() invoked the abort library call in libc to kill the process:
(gdb) bt
#0 0xc01082b8 in kill () from /usr/lib/libc.2
#1 0xc00a52e8 in raise () from /usr/lib/libc.2
#2 0xc00e5c8c in abort_C () from /usr/lib/libc.2
#3 0xc00e5ce4 in abort () from /usr/lib/libc.2
#4 0x2420 in function_abort () from /home/u492893/example/./example
#5 0x23d0 in function_b () from /home/u492893/example/./example
#6 0x23a0 in function_a () from /home/u492893/example/./example
#7 0x2370 in main () from /home/u492893/example/./example
This program is not compiled with the debug option. However, if parts of the program are
compiled using the debug option, you can view information about the source file that contains
this code, the line number of the code where the program crashed, and all the function
parameters. You can also list the source code for the parts of the program that are compiled
using the debug option.
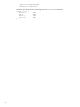
3. Traverse the stack to view the call chain.
Following are some of the basic commands for traversing the stack:
• To traverse (up or down) the call chain, enter the up or down command as in the
following example:
(gdb) up
#1 0xc00a52e8 in raise () from /usr/lib/libc.2
To execute the previous command at gdb prompt, press Enter at the gdb prompt, as in
the following example:
(gdb)
#2 0xc00e5c8c in abort_C () from /usr/lib/libc.2
(gdb)
#3 0xc00e5ce4 in abort () from /usr/lib/libc.2
(gdb)
#4 0x2420 in function_abort () from /home/u492893/example/./example
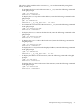
• You can also directly traverse the stack by entering the number of frames as an option
in the up or down command, as follows:
(gdb) up 4
#4 0x2420 in function_abort () from /home/u492893/example/./example
(gdb) down 4
#0 0xc01082b8 in kill () from /usr/lib/libc.2
• To traverse the stack by using the frame number, enter the frame command, as in the
following example:
(gdb) frame 4
#4 0x2420 in function_abort () from /home/u492893/example/./example
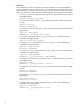
4. Disassemble the required calling function.
To view information about the function prototype and the definition of the structures in the
prototype, you must disassemble the required function. This displays the location of the
stored function parameters if the function has stored the parameters.
The following example illustrates the disassembly of function_abort:
(gdb) disassemble function_abort
Dump of assembler code for function function_abort:
0x23f4 <function_abort>: stw %rp,-0x14(%sr0,%sp)
0x23f8 <function_abort+4>: ldo 0x40(%sp),%sp
0x23fc <function_abort+8>: stw %r26,-0x64(%sr0,%sp)
0x2400 <function_abort+12>: stw %r25,-0x68(%sr0,%sp)
0x2404 <function_abort+16>: ldw -0x64(%sr0,%sp),%r20
0x2408 <function_abort+20>: ldw 8(%sr0,%r20),%r21
0x240c <function_abort+24>: ldi 0x63,%r22
Examples Illustrating Core File Debugging 33