
Debugging Core Files Using HP WDB

If the shared libraries are located at a path that is different from the invoked path, you must
provide WDB with the path for the shared libraries.
To associate the appropriate versions of the shared libraries with the core file, set the environment
variable, GDB_SHLIB_PATH, as follows:
$ export GDB_SHLIB_PATH<path>
NOTE: You can use packcore, and unpackcore to pack, or unpack the core file along with
the relevant executable and libraries in a single tar file, and debug the core file on a different
system from the one on which the core file was invoked.
For more information on debugging a core file from a different system than the one on which
the core file was created, see “Debugging Core Files From a Different System” (page 28)
Common Commands for Core File Debugging
Table 2 lists the common commands for core file debugging.
Table 2 Commonly Used Commands for Core File Debugging
DescriptionCommand
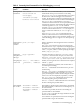
Debugging
Feature
Invokes the core file debugging feature in WDB.
If the executable path is not provided, the debugger selects
the invocation path of the process that generated the core file.
The invocation path information is stored in the core file. If
the invocation path is a relative path, you must enter the
executable while debugging the core file.
At the HP-UX prompt:
$ gdb a.out core
or
$ gdb a.out -c core
or
$ gdb -c core
Invoking the
core file
Displays the backtrace information about the process that
encountered the un-handled signal and the call chain
(including inlined functions). The backtrace is displayed for
the thread where the un-handled signal occurred.
All the stack frames are displayed if no arguments are
specified. If <COUNT> is specified, it display the innermost
COUNT frames. If a negative argument, <-COUNT>, is specified,
it displays the outermost COUNT frames.
backtrace [<-><count>]
where [<-><count>]
Viewing
backtrace
information
The up and the down commands enable you to traverse (up
or down) the call chain in the stack. You can traverse up to a
specific number of frames in the stack if <number> is specified.
The frame <frame-number> command enables you to
traverse the stack frame to the specified frame number,
<frame-number>. This thread is marked with '>' in the info
thread output, while the current selected thread is marked
with a '*' symbol.
up <number>
down <number>
frame <frame-number>
Traversing the
stack
16