
Debugging Core Files Using HP WDB


Support for Invoking GDB Before a Program Aborts
WDB also provides the -crashdebug option to monitor the program execution and invoke the
debugger when the program execution is about to abort. This option provides support for
debugging a live process before the program aborts, instead of debugging the core file after the
program aborts.
Once the debugger is invoked, you can debug the application by using the common debugger
commands. You can examine the state of the process, make changes to the state, and continue
program execution, force a core dump, or terminate execution.
It also enables you to control program execution under the debugger if the program is about to
abort. You can load a new process or attach to a running process for monitoring.
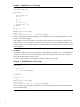
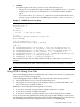
To monitor a new process, enter the following command at the HP-UX prompt:
$ gdb -crashdebug [command][options]
To monitor and attach to a running process, enter the following command at the HP-UX prompt:
$ gdb -crashdebug -pid [pid]
System Requirements for Core File Debugging
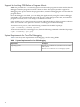
Table 1 lists the system requirements for debugging core files using WDB.
Table 1 System Requirements for Core File Debugging
DescriptionRequirement
HP–UX 11i v1, HP-UX 11i v2, or HP-UX 11i v3 on HP
9000 systems
HP-UX 11i v2 or HP-UX 11i v3 on Integrity systems
Operating System
14