
Debugging Core Files Using HP WDB


• SIGABRT
A SIGABRT signal can be sent to a process in any of the following ways:
— The process can send the abort signal, SIGABRT, by invoking the abort(3) function.
— Another process or the user can invoke the kill command to send the SIGABRT
signal.
— As a result of calls to C++ terminate() function on various runtime library errors.
Example 3 (page 13) illustrates a SIGABRT signal caused by a call to terminate().
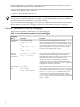
Example 3 SIGABRT Causes a Core Dump
$ cat gdb_throw_example.c
#include <stdio.h>
void foo(int i) {
throw i;
}
int main() {
foo(10); // will not be caught
}
$ a.out
aCC runtime: Uncaught exception of type "int".
Abort(coredump)
Core was generated by `a.out'.
Program terminated with signal 6, Aborted.
(gdb) bt
#0 0x60000000c0349f50:0 in kill+0x30 () from /usr/lib/hpux32/libc.so.1
#1 0x60000000c0240e90:0 in raise+0x30 () from /usr/lib/hpux32/libc.so.1
#2 0x60000000c0304390:0 in abort+0x190 () from /usr/lib/hpux32/libc.so.1
#3 0x60000000c4744cb0:0 in std::terminate () at ../terminate.C:70
#4 0x60000000c476c550:0 in __cxa_throw () at ../NewExceptionHandling.C:610
#5 0x4000ad0:0 in foo () at gdb_throw_example.c:3
#6 0x4000ba0:0 in main () at gdb_throw_example.c:6
This example illustrates the core dump which is caused by a call to the C++ terminate()
function.
For more information about other common signals that can cause core dumps, see signal(5).
NOTE: The SIGKILL signal does not generate a core file.
Using WDB to Debug Core Files
The core file debugging features in WDB enable you to analyze the cause of a core dump and
analyze the process state of an application.
Core file debugging features in WDB are typically used under the following scenarios:
• The program dumps core as a result of programming errors.
• The program is forced to dump core by using the dumpcore command in WDB, or the
gcore utility, that is available on HP-UX.
WDB can be used to debug the following kinds of core files:
• A core file is created by a program that is compiled without the –g option.
• A core file is created by a stripped executable.
• A core file is created by a program, and the source code for the program is available.
If you can reproduce the problem when running the program under WDB, it is easier to use a
live debugging session in WDB to debug the program, instead of debugging the core file. However,
the same debug information in the program can be used for core file debugging.
Using WDB to Debug Core Files 13