
Debugging Core Files Using HP WDB

Introduction
HP Wildebeest Debugger (WDB) is an HP-supported implementation of the open source debugger
GDB. Apart from performing the normal debugging functions, it also enables you to debug core
files and analyze the process state of an application.
HP WDB debugs core files that are created by source-level programs written in HP C, HP aC++,
and Fortran 90 on Itanium®-based systems running HP-UX 11i v2 or HP-UX 11i v3, and HP 9000
systems running HP-UX 11i v1, HP-UX 11i v2, or HP-UX 11i v3 operating systems.
What Is a Core File?
A core dump is an abnormal termination of a program. The most common types of programming
errors that can cause a core dump include program aborts, memory violations, bus errors, and
illegal instructions. When a core dump occurs during the execution of a program, the core file,
core, is created in the working directory of the terminated process. This core file reflects the
memory image of the terminated process. You can use the information in a core file to debug an
abnormally-terminated program and analyze the causes for the core dump.
Causes for a Core Dump
When a kernel encounters an un-handled signal, it creates a core file for that process. Alternately,
the user can force a core dump to create a core file (through WDB or by using gcore).
The file command is the simplest method to analyze the cause of a core dump at the HP-UX
prompt.
The file command displays the signal that triggered the core dump.
For example:
$ file core
core: core file from 'a' - received SIGBUS
This example illustrates that the program dumped a core after receiving the SIGBUS signal.
Common Signals That Cause Core Dumps
Following are some signals that commonly cause core dumps:
• SIGBUS
One reason why aSIGBUS signal is sent to a process is when the program attempts to load
or store a data item at a non-aligned address.
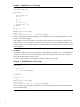
Example 1 illustrates a load or store operation of a data item at a non-aligned address.
Introduction 11