
Debugging C++ Applications Using HP WDB (766162-001, March 2014)


3 static int x=40;
4
5 void func(void) {
6 static int x=30;
7 printf("%d\n", x);
8 }
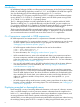
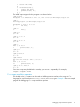
The WDB output snippet for this program is as shown below:
(gdb) b main
Breakpoint 1 at 0x40009f0:0: file a.C, line 8 from /C++WhitePaper/scope/a.out.
(gdb) r
Starting program: /C++WhitePaper/scope/a.out
Breakpoint 1, main () at a.C:8
8 int x=20;
(gdb) n
9 func();
(gdb) p x
$1 = 20
(gdb) p 'a.C'::x
$2 = 10
(gdb) p 'b.C'::x
$3 = 40
(gdb) s
func () at b.C:7
7 printf("%d\n", x);
(gdb) p x
$4 = 30
(gdb) p main::x
$5 = 20
(gdb) finish
Run till exit from #0 func () at b.C:7
30
main () at a.C:10
10 printf("%d\n", x);
(gdb) p 'b.C'::func::x
$6 = 30
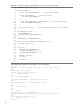
Since one scope may be defined in another, you can use :: repeatedly. For example,
scope1::scope2::name.
C++ scope resolution operator
The double colon (::) notation can be used as WDB expressions similar to the usage in C++
language for scope resolution on struct, union, and class types. Example 3 shows a sample
program for debugging C++ scope resolution operator.
Debugging scope resolution operator 9