
Debugging C++ Applications Using HP WDB (766162-001, March 2014)
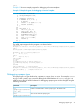

NOTE: HP WDB supports debugging of C++ applications with new() and delete() calls only
if they internally call malloc() and free() functions.
Example 22 shows a sample program for debugging dynamic memory allocation and de-allocation.
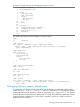
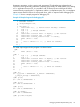
Example 22 Sample program for Debugging Dynamic Memory Allocation
1 #include <iostream>
2 using namespace std;
3
4 class Tree {
5 int height;
6 public:
7 Tree(int treeHeight) : height(treeHeight) {}
8 };
9
10 void func(void) {
11 Tree* t = new Tree(10);
12 // delete t;
13 }
14
15 int main() {
16 int i;
17 for(i=0; i<10; i++)
18 func();
19 cout << "Memmory leaked !!!";
20 return(0);
21 }
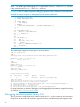
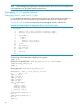
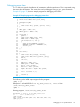
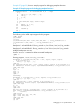
The WDB output snippet for this program is as shown below:
(gdb) set heap-check on
(gdb) r
Starting program: /user/username/task_new/C++WhitePaper/dynamic/allocate
Breakpoint 1, main () at allocate.C:17
17 for(i=0; i<10; i++)
(gdb) c
Continuing.
Memmory leaked !!!
Breakpoint 2, main () at allocate.C:20
20 return(0);
(gdb) info leaks
Scanning for memory leaks...
40 bytes leaked in 10 blocks
No. Total bytes Blocks Address Function
0 40 10 0x40012610 operator new(unsigned long)
(gdb) info leaks 0
40 bytes leaked in 10 blocks (100.00% of all bytes leaked)
These range in size from 4 to 4 bytes and are allocated
#0 0x200000007b47ad92 in operator new(unsigned long) from /usr/lib/hpux32/libCsup.so.1
#1 0x04000d92 in func() at allocate.C:11
#2 0x04000f42 in main() at allocate.C:18
#3 0x200000007b770c82 in main_opd_entry() from /usr/lib/hpux32/dld.so
For more information on memory debugging, see Debugging Dynamic Memory Usage Errors Using
HP WDB at http://www.hp.com/go/wdb.
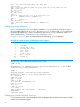
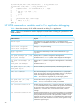
Debugging standard template library (STL)
The STL provides a ready-made set of common classes for C++, such as containers and associative
arrays, that can be used with any built-in type and with any user-defined type that supports some
34