
Debugging C++ Applications Using HP WDB (766162-001, March 2014)
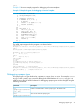
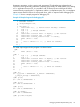

Example 21 Sample Program for Debugging Anonymous Unions
1 #include<iostream>
2 using namespace std;
3
4 struct {
5 char title[50];
6 char author[50];
7 union {
8 float dollars;
9 int yen;
10 };
11 } book;
12
13 int main() {
14 strcpy(book.title, "mybook");
15 strcpy(book.author, "me");
16 book.dollars = 2.3;
17 return(0);
18 }
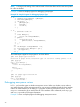
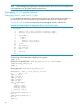
The WDB output snippet for this program is as shown below:
(gdb)
17 return(0);
(gdb) p book
$1 = {title = "mybook", '\000' <repeats 43 times>,
author = "me", '\000' <repeats 47 times>, {dollars = 2.29999995,
yen = 1075000115}}
(gdb) ptype book
type = struct {
char title[50];
char author[50];
union {
float dollars;
int yen;
};
}
(gdb) whatis book.dollars
type = float
(gdb) p sizeof(book)
$2 = 104
(gdb) p book.yen=300
$3 = 300
(gdb) p book
$4 = {title = "mybook", '\000' <repeats 43 times>,
author = "me", '\000' <repeats 47 times>, {dollars = 4.20389539e-43,
yen = 300}}
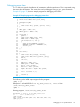
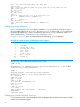
Debugging dynamic memory related issues
In C language, the dynamic memory allocation and de-allocation is performed using functions,
such as malloc(), calloc(), realloc(), and so on. Whereas in C++ language, the dynamic
memory allocation and de-allocation is done using operators new() and delete(). The dynamic
memory allocation and de-allocation takes place on a heap. HP WDB shows application’s heap
usage and memory-related errors, such as leaks, corruptions, and so on, which occur till any
particular point in execution.
Debugging dynamic memory related issues 33