
Debugging C++ Applications Using HP WDB (766162-001, March 2014)
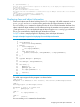
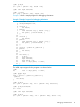

(gdb) p &y
[1] y
[2] first::y
[3] second::y
> 3
$2 = (double *) 0x40010188
(gdb) call func()
[1] func()
[2] first::func()
[3] second::func()
> 1
I am global.
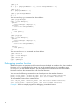
(gdb) show namespaces-enabled
Enabling of namespace support is on.
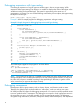
(gdb) set namespaces-enabled off
(gdb) p x
$3 = 97 'a'
(gdb) ptype y
type = char
(gdb) ptype first::y
type = int
(gdb) p second::y
$4 = 2.7183000000000002
(gdb) call func()
I am global.
Debugging inline functions
Inline functions are functions which get expanded at the place of call itself, like a preprocessor
macro, so the overhead of the function call is eliminated. In C++ programs, debugging inline
functions is important as the class member functions are generally inlined.
To enable inline debugging on HP 9000 systems, the applications must be compiled with the
+inline_debug option that is available in the A.03.65 and later versions of the HP aC++
compiler. On HP Integrity systems, the applications that are compiled with –g option support inline
debugging by default and require no additional options. The compiler A.06.02 versions and later
support the inline debugging feature in HP Integrity systems.
WDB 5.6 and later versions enable you to set and modify breakpoints in inline functions for
programs compiled with optimization level less than +O2. The breakpoint features for inline functions
are introduced as additional options in the set inline-debug command.
You can set the behavior of WDB for inline debugging by performing either of the following
operations:
From command line:
$ gdb --inline=<option>
OR
At gdb prompt:
(gdb) set inline-debug <option>
Debugging inline functions 19