
Debugging C++ Applications Using HP WDB (766162-001, March 2014)
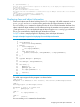

type = class myclass {
public:
int member;
static int s_member;
void func();
static void s_func();
} * const
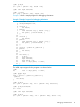
NOTE:
• You cannot set a breakpoint on object-specific member functions.
• You can access this pointer from WDB command line while in a member function as shown
in the above example. Using this pointer, the data members of that class can be accessed
from the WDB command line.
• Other commands, such as backtrace, info function, info arguments, and so on
can be used in conjunction with member function as they are used for normal functions.
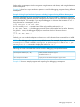
Debugging inherited classes
A key feature of C++ classes is inheritance. Inheritance allows creating classes, which are derived
from other classes, so that they automatically include some of its "parent's" members, in addition
to their own. The ptype command can be used in WDB to display the immediate inheritance
relationship of the given object or a class.
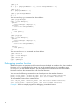
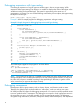
Example 6 shows a sample program for single inheritance.
Example 6 Sample Program for Single Inheritance
1 #include <iostream>
2 using namespace std;
3
4 class A {
5 int dataA;
6 public:
7 void setA(int arg) { dataA = arg; }
8 int getA() { return dataA; }
9 };
10
11 class B : public A {
12 public:
13 int dataB;
14 };
15
16 int main() {
17 B objB;
18 objB.setA(20);
19 objB.dataB = 40;
20 cout << objB.getA() << endl;
21 }
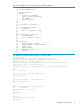
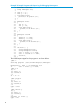
The WDB output snippet for this program is as shown below:
(gdb) n
19 objB.dataB = 40;
(gdb) n
20 cout << objB.getA() << endl;
(gdb) ptype objB
type = class B : public A {
public:
int dataB;
}
14