
HP Caliper User Guide Release 5.5 (5900-2351, August 2012)
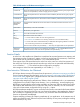
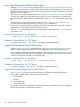
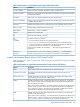
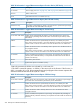

Table 33 Information in scgprof Measurement Report: Children Listings (continued)
DescriptionColumn
Name of this child function.Children
Cycle that this child is a member of, if any.Cycle
The cycle as a whole is listed with the same fields as a function entry. Beneath it are listed
the members of the cycle, and their contributions to the time and call counts of the cycle.
Above it are listed the non-member functions that called the different members of this cycle,
the number of hits propagated to every one of these callers, and the call counts for every
one of these callers from outside the cycle.
*Static-only parents and children are indicated by a call count of 0.
**This field is omitted for parents, or children, in the same cycle as the function. If the function, or
child, is a member of a cycle, the propagated times and propagation denominator represent the
self time and descendant time of the cycle as a whole.
traps Measurement Report Description
Available only on Integrity servers dual-core Itanium 2 and Itanium 9300 quad-core processor
systems.
With the traps measurement, produced by the traps measurement configuration file, HP Caliper
collects and reports a profile of traps, interrupts, and faults.
The trap profile is produced by statistical sampling of the execution trace buffer (ETB) configured
to capture all changes to/from privilege level 0. By default, the traps measurement samples the
ETB at every 1,000 CPU cycles, with a variation of 5 percent, and a threshold of 0.
You can change the sampling rate, sampling variation, and threshold with the -s period option.
You should not change the default event (CPU_CPL_CHANGES.LVL0) or the privilege level mask
(all).
You can use the --traps-reported option to specify which traps, interrupts, and faults are
reported. By default, the top 6 traps, interrupts, and faults are reported.
At collection time, information about all 34 traps, interrupts, and faults is collected. The
--traps-reported option only dictates what is reported. You can get a report on different
traps, interrupts, and faults from the same database, using different caliper report runs.
You can specify the names of from 1 to 6 comma-separated traps, interrupts, and faults. Possible
names that you can choose for reporting are:
32INCPT IA32 Intercept
32INRPT IA32 Interrupt
ADTLB Alternate data translation lookaside buffer fault
AITLB Alternate instruction translation lookaside buffer fault
BREAK Break instruction fault
DACCS Data access bit fault
DARGHT Data access rights fault
DBIT Data dirty bit fault
DEBUG Debug fault
DFPREG Disabled floating-point register fault
DKEY Data key miss fault
DNTLB Data nested translation lookaside buffer fault
DTLB Data translation lookaside buffer fault
FPFLT Floating-point Fault
FPTRP Floating-point Trap
GEXCP General exception:
traps Measurement Report Description 225