
HP Caliper 5.7 User Guide (769153-001, March 2014)
• RSE Stack - the RSE stack area
• Memory mapped shared library - the data area of the shared libraries mapped to the process
• Memory mapped region - all other memory mapped regions
If there is more than one region of the same type, they are combined and reported as a single
entry.
The Data Summary report is generated per-process. For a per-thread report, use the --thread
all option. For a per-module report, use the --per-module-data True option.
The Data Summary report can be merged or differenced across two databases that contain the
Data Summary information.
If a process exec()s, HP Caliper does not discover the process regions. In this case, the data
addresses are mapped to global variables, and any unassigned samples are reported as unknown
samples. A diagnostics message is generated with the report.
Using the --dcache-stores Option to Produce a Data Cache Store Profile
On the Intel® Itanium® 9500 series processors you can get a Data Cache Store Profile using the
--dcache-stores command line option or measure_dcache_stores option in the dcache
configuration file. The Data Cache Store profile shows a histogram of data cache store misses by
location.
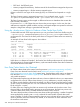
An example of Data Store Profile output is shown below:
Function Summary
-------------------------------------------------------------------
% Total Sampled
Dcache Cumulat Dcache
Latency % of Store
Cycles Total Misses Function File
-------------------------------------------------------------------
99.10 99.10 5269 matmul.O1::matrix_multiply matmul.c
0.55 99.64 29 libc.so.1::random random.c
0.23 99.87 12 matmul.O1::initialize matmul.c
0.13 100.00 7 matmul.O1::zero matmul.c
-------------------------------------------------------------------
Unlike the dcacheReport in Example 5, the Dcache Store Profile provides report of only the number
of Dcache Misses. It cannot indicate the latency cycles associated with the misses due to limitations
of the Intel® Itanium® 9500 PMU.
How Data Cache Metrics Are Obtained
HP Caliper obtains data cache metrics from the processor's performance monitoring unit (PMU).
Exact counts are obtained from the PMU's set of performance monitor configuration
(PMC)/performance monitor data (PMD) register pairs. Sampled data cache metrics are obtained
from the PMU's data event address register (D-EAR). Both sets of metrics focus on the L1 cache,
with notable exceptions.
HP Caliper takes samples every Nth data cache miss, where N is defined in the dcache measurement
configuration file in the HP Caliper home directory config subdirectory. At each sample point,
HP Caliper records both the instruction that resulted in a data cache miss and the latency (number
of clock cycles) incurred by the miss. You can override the value in the measurement configuration
file by using the -s option.
For data cache miss sampling, the PMU can monitor only one data cache load at a time. Since
there are likely to be multiple loads in progress at any given moment, the PMU can process only
a subset of data cache misses. The PMU randomizes which loads it monitors.
This means that the number of data cache misses observed through sampling—number of sampled
misses multiplied by sampling rate—is only a subset of the total number of actual data cache
misses. Therefore, it is best to interpret sampling data not as an indication of how many data cache
misses a particular instruction incurred, but, instead, as an indication of which instructions incur
the most data cache misses.
200 Descriptions of Measurement Reports