
Using HP-UX Workload Manager: A quick reference
29
How do I monitor HP-UX Workload Manager?
There are several methods for monitoring WLM, as described in the following sections.
ps [-P] [-R workload_group]
The ps command has options that are specific to PRM, which WLM uses to define workload groups
when dividing resources within a single HP-UX instance:
•-P
This option adds the column PRMID, showing the workload group for each process.
# ps -P
PRMID PID TTY TIME COMMAND
g3 6793 ttyp1 1:52 loop.pl
g3 6463 ttyp1 7:02 loop3.pl
g2 6462 ttyp1 4:34 loop2.pl
•-R workload_group
This option lists only the processes in the group named by workload_group. The following output
shows processes in the workload group g3:
# ps -R g3
PID TTY TIME COMMAND
6793 ttyp1 1:29 loop.pl
6463 ttyp1 6:41 loop3.pl
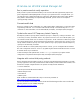
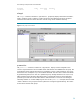
wlminfo
The wlminfo command, available in /opt/wlm/bin/, displays information about SLOs, metrics,
workload groups, virtual partitions or nPartitions, and the current host. The following example displays
group information:
# wlminfo group
Workload Group PRMID CPU Shares CPU Util Mem Shares Mem Util State
OTHERS 1 65.00 0.00 6.00 2.10 ON
g2 2 15.00 0.00 64.00 32.43 ON
g3 3 20.00 0.00 30.00 9.17 ON
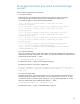
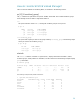
The following example shows partition information:
% /opt/wlm/bin/wlminfo par
Hostname Intended Cores Cores Cores Used Interval
north 2 2 1.3 6
south 3 3 2.1 6
east 1 1 0.4 6
west 2 2 1.7 6
northwest 3 3 2.3 6
northeast 2 2 1.4 6