
HP-UX Workload Manager User's Guide

Advanced WLM usage: Using performance metrics
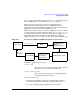
Supplying data to WLM
Appendix H508
Step 3. Ensure that ttd is configured and running. For more information, see
ttd(1).
Step 4. Start the program you instrumented with ARM calls.
The start and stop times for your transactions will now be made
available through the HP ARM implementation. For more information,
see ttd(1) and midaemon(1).
Step 5. Edit your WLM configuration to pick up the transaction data.
To extract ARM data (from the HP ARM implementation) and forward it
to WLM, use wlmrcvdc with the glance_tt command in the
configuration file:
tune metric {
...
coll_argv = wlmrcvdc glance_tt
TT_*_metric # Metric you choose to monitor
ARM_app # Application registered with ARM
transaction [user]; # Transaction in the
# application to get the metric for, along
# with an application user
...
}
The metric you choose, generically referred to as TT_*_metric
previously, is typically from the Transaction metric class (TT_*), but can
also be an expression that combines a transaction metric with metrics
from the Global (GBL_*) and Table (TBL_*) metric classes.
You can fine-tune transaction tracking in the /var/opt/perf/ttd.conf file if
desired. This file has an entry (tran=*) that enables all transactions to
be tracked. However, you may want to fine-tune what is tracked. For
more information, see ttd(1) and the ttd.conf file or ttd.conf(4).
For more information on the wlmrcvdc utility, see “Sending data via
stdout” on page 499.
Step 6. Activate your WLM configuration:
# wlmd -a configfile
For information on the ARM API and the ARM software developer’s kit,
see:
http://www.cmg.org/regions/cmgarmw