
HP-UX Workload Manager User's Guide

Advanced WLM usage: Using performance metrics
Supplying data to WLM
Appendix H 505
If you are using the HP ARM implementation, you can send transaction
data to WLM using wlmrcvdc with the glance_tt command.
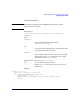
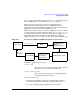
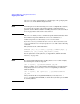
Figure H-1 presents an overview of how an application that is
instrumented with ARM API calls works with WLM. First, the
application invokes the ARM API calls, made available through libarm.
libarm then feeds the data from the ARM calls to an
implementation-specific storage facility. An ARM collection agent, in this
case GlancePlus, then picks up this data. Next, wlmrcvdc / glance_tt or
a user-written data collector sends the relevant data to WLM to use in
determining CPU allocations. The new allocations then affect the
application’s performance, which is again tracked by the ARM API calls.
Figure H-1 Interaction of WLM and ARM-instrumented applications
Examples of transaction metrics are:
TT_WALL_TIME
The total time, in seconds, of all transactions completed
during the last interval for this transaction.
TT_WALL_TIME_PER_TRAN
The average transaction time, in seconds, during the
last interval for this transaction.
For a list of metrics, see:
• The Transaction Metrics subsection of the Performance Metrics
section in the GlancePlus online help, available through gpm
• One of the /opt/perf/paperdocs/gp/C/metrics.* documents
Application
arm_start()
arm_stop()
libarm
HP-UX WLM
CPU
resources
ARM collection agent
Implementation-
specific
database/kernel
wlmrcvdc /
glance_tt or
user-written
data collector