
HP-UX Workload Manager User's Guide

Advanced WLM usage: Using performance metrics
Supplying data to WLM
Appendix H498
mincpu = 15;
maxcpu = 25;
entity = PRM group crunch;
goal = metric job_time < 2.0;
}
# Set up wlmrcvdc
tune job_time {
coll_argv = wlmrcvdc;
}
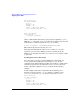
Next, set up wlmsend in a loop in a perl program. Here, the function
get_value provides the metrics to feed wlmsend. Alternatively the
program itself could interact with the workload to gather performance
data. Add a sleep command to slow down how often metrics are
retrieved. The loop might look the following:
while (1) {
$value = &get_value;
system “/opt/wlm/bin/wlmsend job_time $value”;
sleep(60);
}
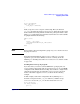
The loop could also look like the following loop, using a print statement
instead of a system statement:
open(WLM, “| /opt/wlm/bin/wlmsend job_time”);
# make the new file descriptor unbuffered
select ((select(WLM), $|=1)[0]);
while (1) {
$value = &get_value;
print WLM “$value\n”;
sleep(60);
}
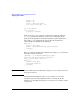
NOTE Run your data collection script in the group PRM_SYS to ensure it receives
the proper resources.
For background information on how wlmsend and wlmrcvdc work
together to get your data to WLM, as well as a warning about I/O
buffering, see “Sending data with wlmsend and wlmrcvdc: How it works”
on page 509.