
HP-UX Workload Manager User's Guide

Advanced WLM usage: Using performance metrics
Supplying data to WLM
Appendix H492
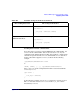
To extract PRM by volume group data (PRM_BYVG_* metrics), use
wlmrcvdc with the glance_prm_byvg command in the configuration file.
For example:
tune vg_util {
...
coll_argv = wlmrcvdc glance_prm_byvg
PRM_BYVG_GROUP_UTIL # Metric to monitor
Grp17 /dev/vg03;
# Name of workload (PRM) group
# and logical volume group
...
}
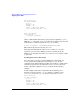
For wlmrcvdc conceptual information, see “Sending data with wlmsend
and wlmrcvdc: How it works” on page 509. For wlmrcvdc syntax
information, see “wlmrcvdc” on page 388.
Oracle database data
Oracle database data provides SQL values or elapsed time (walltime)
resulting from executing SQL statements against an Oracle instance.
Examples of Oracle database metrics are:
• Number of users connected to an instance
• Number of processes in an instance
• A particular user is connected
• A particular job is active
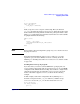
To extract Oracle database data, use wlmrcvdc with the wlmoradc
command in the configuration file:
tune oracle.instance1.user_cnt {
coll_argv =
wlmrcvdc
wlmoradc
--configfile /opt/wlm/toolkits/oracle/config/user_cnt.oradc
--home /oracle/app/oracle/product/8.1.5
--instance instance1
;
}
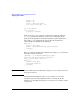
For more ideas on the metrics you can collect, as well as information on
wlmoradc, see “Integrating with Oracle® databases” on page 426 or see
wlmoradc(1M).