
HP-UX Workload Manager User's Guide

Advanced WLM usage: Using performance metrics
Supplying data to WLM
Appendix H 491
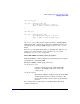
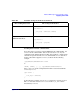
tune active_procs {
...
coll_argv = wlmrcvdc glance_prm
APP_ACTIVE_PROC # Metric to monitor
Grp3; # Name of workload (PRM) group
...
}
tune mem_util {
...
coll_argv = wlmrcvdc glance_prm
APP_PRM_MEM_UTIL # Metric to monitor
Grp3; # Name of workload (PRM) group
...
}
Use glance_prm to collect metrics of the form APP_* and APP_PRM_*.
Although the APP_* metrics do not appear to be PRM-related, they are
actually specific to workload (PRM) groups by virtue of glance_prm’s
design.
For wlmrcvdc conceptual information, see “Sending data with wlmsend
and wlmrcvdc: How it works” on page 509. For wlmrcvdc syntax
information, see “wlmrcvdc” on page 388.
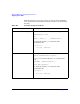
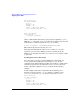
GlancePlus PRM-controlled volume group data
GlancePlus PRM by volume group data provides information on volume
groups that are controlled by PRM.
Examples of PRM by volume group metrics are:
PRM_BYVG_GROUP_UTIL
A group’s current percentage of disk bandwidth
relative to other PRM groups’ usage of the same
volume group.
PRM_BYVG_REQUEST
The number of Kbytes (or Mbytes if specified) the PRM
group requested to have read from or written to the
logical volumes in the current volume group during the
interval.
For a full list of the available data, see the GlancePlus online help,
available through gpm.