
HP-UX Workload Manager User's Guide

Monitoring SLO compliance and WLM
Monitoring WLM with EMS
Chapter 10 359
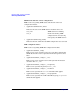
To demonstrate how these EMS resources function, consider the
following WLM configuration:
slo orders {
pri = 1;
entity = PRM group sales;
cpushares = 1 total per metric more_1;
}
slo buying {
pri = 1;
entity = PRM group marktg;
goal = usage_CPU;
}
tune {
absolute_cpu_units = 1;
wlm_interval = 1;
}
tune more_1 {
coll_argv = /workforce/sales/data_collector division1;
cntl_avg = 1;
cntl_smooth = 0.4;
}
prm {
groups = sales : 3, marktg : 4;
}
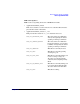
The EMS instances returned for the metric more_1 in this configuration
would be as follows, where current_value (reported for metric_status)
is the current value (which changes at each WLM interval) :
/applications/wlm/metric_status/more_1/
current_value
/applications/wlm/metric_config/more_1/coll_argv/
"/workforce/sales/data_collector division1"
/applications/wlm/metric_config/more_1/cntl_avg
WM_METRIC_CNTL_AVG_ON
/applications/wlm/metric_config/more_1/cntl_smooth
0.40000