
HP-UX Workload Manager User's Guide

Monitoring SLO compliance and WLM
Monitoring WLM with the wlmgui command
Chapter 10 351
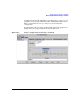
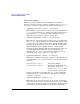
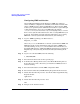
In addition to the default ‘CPU Shares’ and ‘CPU Usage’ values, you can
graph the selected groups’ ‘Minimum CPU’ and ‘Maximum CPU’ values.
These correspond to the gmincpu and gmaxcpu keywords in the
configuration.
To adjust what values are being graphed, right-click in the graph area to
display the menu of options. Figure 10-4 shows this menu.
Figure 10-4 Items to graph when monitoring a workload